

An approach of orthology detection from homologous sequences under minimum evolution
- PMID: 18676448
- PMCID: PMC2553584
- DOI: 10.1093/nar/gkn485
An approach of orthology detection from homologous sequences under minimum evolution
Abstract
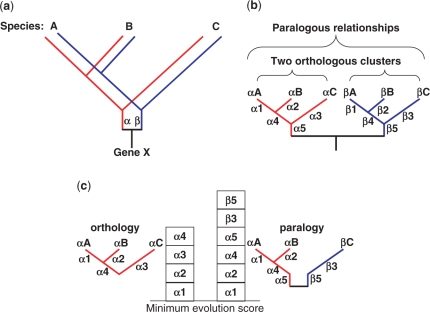
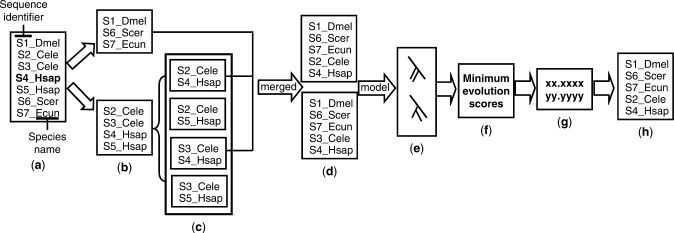
In the field of phylogenetics and comparative genomics, it is important to establish orthologous relationships when comparing homologous sequences. Due to the slight sequence dissimilarity between orthologs and paralogs, it is prone to regarding paralogs as orthologs. For this reason, several methods based on evolutionary distance, phylogeny and BLAST have tried to detect orthologs with more precision. Depending on their algorithmic implementations, each of these methods sometimes has increased false negative or false positive rates. Here, we developed a novel algorithm for orthology detection that uses a distance method based on the phylogenetic criterion of minimum evolution. Our algorithm assumes that sets of sequences exhibiting orthologous relationships are evolutionarily less costly than sets that include one or more paralogous relationships. Calculation of evolutionary cost requires the reconstruction of a neighbor-joining (NJ) tree, but calculations are unaffected by the topology of any given NJ tree. Unlike tree reconciliation, our algorithm appears free from the problem of incorrect topologies of species and gene trees. The reliability of the algorithm was tested in a comparative analysis with two other orthology detection methods using 95 manually curated KOG datasets and 21 experimentally verified EXProt datasets. Sensitivity and specificity estimates indicate that the concept of minimum evolution could be valuable for the detection of orthologs.
Figures

Similar articles
-
Tree pattern matching in phylogenetic trees: automatic search for orthologs or paralogs in homologous gene sequence databases.Bioinformatics. 2005 Jun 1;21(11):2596-603. doi: 10.1093/bioinformatics/bti325. Epub 2005 Feb 15. Bioinformatics. 2005. PMID: 15713731
-
Improving the specificity of high-throughput ortholog prediction.BMC Bioinformatics. 2006 May 28;7:270. doi: 10.1186/1471-2105-7-270. BMC Bioinformatics. 2006. PMID: 16729895 Free PMC article.
-
Integrating Sequence Evolution into Probabilistic Orthology Analysis.Syst Biol. 2015 Nov;64(6):969-82. doi: 10.1093/sysbio/syv044. Epub 2015 Jun 30. Syst Biol. 2015. PMID: 26130236
-
Inferring orthology and paralogy.Methods Mol Biol. 2012;855:259-79. doi: 10.1007/978-1-61779-582-4_9. Methods Mol Biol. 2012. PMID: 22407712 Review.
-
A pluralistic account of homology: adapting the models to the data.Mol Biol Evol. 2014 Mar;31(3):501-16. doi: 10.1093/molbev/mst228. Epub 2013 Nov 22. Mol Biol Evol. 2014. PMID: 24273322 Free PMC article. Review.
Cited by
-
Cetaceans evolution: insights from the genome sequences of common minke whales.BMC Genomics. 2015 Jan 22;16(1):13. doi: 10.1186/s12864-015-1213-1. BMC Genomics. 2015. PMID: 25609461 Free PMC article.
-
HGTree: database of horizontally transferred genes determined by tree reconciliation.Nucleic Acids Res. 2016 Jan 4;44(D1):D610-9. doi: 10.1093/nar/gkv1245. Epub 2015 Nov 17. Nucleic Acids Res. 2016. PMID: 26578597 Free PMC article.
-
Inferring Orthologs: Open Questions and Perspectives.Genomics Insights. 2016 Feb 25;9:17-28. doi: 10.4137/GEI.S37925. eCollection 2016. Genomics Insights. 2016. PMID: 26966373 Free PMC article. Review.
-
Comparative genomic analysis reveals genetic features related to the virulence of Bacillus cereus FORC_013.Gut Pathog. 2017 May 15;9:29. doi: 10.1186/s13099-017-0175-z. eCollection 2017. Gut Pathog. 2017. PMID: 28515790 Free PMC article.
-
An Effective Big Data Supervised Imbalanced Classification Approach for Ortholog Detection in Related Yeast Species.Biomed Res Int. 2015;2015:748681. doi: 10.1155/2015/748681. Epub 2015 Oct 29. Biomed Res Int. 2015. PMID: 26605337 Free PMC article.
References
-
- Owen R. London: Longman, Brown, Green and Longmans; 1843. Lectures on the Comparative Anatomy and Physiology of the Invertebrate Animals.
-
- Fitch WM. Homology a personal view on some of the problems. Trends Genet. 2000;16:227–231. - PubMed
-
- Graur D, Li W-H, editors. 2nd edn. Sunderland, MA: Sinauer Associates; 2000. Fundamentals of Molecular Evolution.
-
- Fitch WM. Distinguishing homologous from analogous proteins. Syst. Zool. 1970;19:99–106. - PubMed
-
- Sonnhammer ELL, Koonin EV. Orthology, paralogy and proposed classification for paralog subtypes. Trends Genet. 2002;18:619–620. - PubMed
Publication types
MeSH terms
Substances
LinkOut - more resources
Full Text Sources
Research Materials
