. 2008 Sep;148(1):246-58.
doi: 10.1104/pp.108.121897. Epub 2008 Jul 25.

In planta analysis of the cell cycle-dependent localization of AtCDC48A and its critical roles in cell division, expansion, and differentiation

Affiliations

In planta analysis of the cell cycle-dependent localization of AtCDC48A and its critical roles in cell division, expansion, and differentiation

Sookhee Park et al. Plant Physiol. 2008 Sep.

Abstract

CDC48/p97 is a conserved homohexameric AAA-ATPase chaperone required for a variety of cellular processes but whose role in the development of a multicellular model system has not been examined. Here, we have used reverse genetics, visualization of a functional Arabidopsis (Arabidopsis thaliana) CDC48 fluorescent fusion protein, and morphological analysis to examine the subcellular distribution and requirements for AtCDC48A in planta. Homozygous Atcdc48A T-DNA insertion mutants arrest during seedling development, exhibiting decreased cell expansion and displaying pleiotropic defects in pollen and embryo development. Atcdc48A insertion alleles show significantly reduced male transmission efficiency due to defects in pollen tube growth. Yellow fluorescent protein-AtCDC48A, a fusion protein that functionally complements the insertion mutant defects, localizes in the nucleus and cytoplasm and is recruited to the division mid-zone during cytokinesis. The pattern of nuclear localization differs according to the stage of the cell cycle and differentiation state. Inducible expression of an Atcdc48A Walker A ATPase mutant in planta results in cytokinesis abnormalities, aberrant cell divisions, and root trichoblast differentiation defects apparent in excessive root hair emergence. At the biochemical level, our data suggest that the endogenous steady-state protein level of AtCDC48A is dependent upon the presence of ATPase-active AtCDC48A. These results demonstrate that CDC48A/p97 is critical for cytokinesis, cell expansion, and differentiation in plants.


Figures
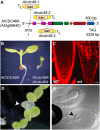
Figure 1.
Figure 1.
Schematic representation of Atcdc48AT-DNA mutant alleles and the phenotypes of Atcdc48AT-DNA seedlings, seeds, and embryos. A, The exon/intron gene structure of AtCDC48A is shown to scale with broad-colored boxes representing exons and black inter-exon thin lines representing introns. The colors of the exons correspond to the DNA-coding regions encoding the protein domains of AtCDC48A: pink, N terminus; black, linker 1; green, D1 ATPase; orange, linker 2; red, D2 ATPase; blue, C terminus. The position and directions of T-DNA inserts with left border sequences are indicated (TL). T-DNAs are not drawn to scale. kan, T-DNA neomycin phosphotransferase selectable gene marker. B, Stereo micrograph of 5-d-old wild-type AtCDC48A and homozygous Atcdc48AT-DNA mutant seedlings. Homozygous Atcdc48AT-DNA plants die soon after this stage of development. C, Roots of 5-d-old wild-type AtCDC48A (WT) and homozygous Atcdc48AT-DNA mutant (mt) plants stained with propidium iodide and imaged by LSCM. The mutant root image comprises the entire root length (as shown in B), while the left image corresponds to only tip of the wild type. Scale bar = 10 μm. D, Stereo micrograph of a portion of an immature silique from a self-fertilized heterozygous Atcdc48AT-DNA plant approximately 10 d after fertilization. A pale green Atcdc48A homozygous seed is indicated by an arrowhead. E, Sibling embryos of an immature silique (approximately 5 d after fertilization) from a self-fertilized heterozygous Atcdc48AT-DNA plant. Mutant embryo development is shown arrested at the heart stage (arrowhead).
Figure 2.
Figure 2.
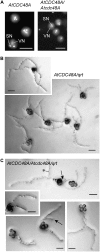
Analysis of development and tube germination of pollen from AtCDC48A and heterozygous Atcdc48A plants. A, Pollen grains from wild-type (left) and heterozygous Atcdc48AT-DNA (right) plants were examined at onset of desiccation by epifluorescence microscopy after DAPI staining. SN, Sperm nuclei; VN, vegetative nucleus. Scale bars = 15 μm. B and C, Pollen grains from qrt (AtCDC48A;qrt; B) and heterozygous Atcdc48AT-DNA;qrt (Atcdc48A/+;qrt; C) plants were germinated on pollen germination media at 28°C for 24 h and then imaged with DIC optics. Arrows indicate Atcdc48A mutant pollen tubes. Asterisk indicates a pollen tube from outside the field of view. Scale bars = 50 μm.
Figure 3.
Figure 3.
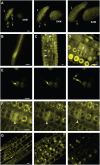
Localization of YFP-AtCDC48A in transgenic homozygous Atcdc48AT-DNA seedlings. Transgenic T3 seedlings were examined 3 d after germination. A, Representative LSCM images of YFP-AtCDC48A expressed in leaves (L), trichomes (T), and the shoot apical meristem (SAM). Scale bar = 10 μm. The three segments correspond to the first (left), middle, and last (right) images of a serial Z-stack set taken down the vertical axis of the plant. See Supplemental Movie S1 for complete Z-stack series of images. B, Expression of YFP-AtCDC48A in the root visualized by wide-field fluorescence microscopy. Scale bar = 100 μm. C and D, YFP-AtCDC48A expression in the root division zone visualized by LSCM. Scale bar = 10 μm. Division plane localization is indicated by arrowheads. Spindle localization is indicted by arrows. Asterisks indicate vesicle-like structures located neighboring developing nuclear membranes. E, The vegetative nucleus during pollen tube elongation. The three segments correspond to the first (left), middle, and last (right) images of a time series taken during pollen tube elongation in vitro. See Supplemental Movie S2 for complete time series. Arrow indicates the tip of the pollen tube. Scale bar = 10 μm. F, YFP-AtCDC48A localization during karyokinesis in dividing root cells. The three segments correspond to the first (left), middle, and last (right) images of a time series taken during root cell division. See Supplemental Movie S3 for complete time series. Arrowhead indicates a dividing cell division plane. Scale bar = 10 μm. G, YFP-AtCDC48A nucleus localization in the primary root elongation zone. The three segments correspond to the first (left), middle, and last (right) images of a serial Z-stack set taken perpendicular to the root radial axis. See Supplemental Movie S4 for complete Z-stacks. Scale bar = 10 μm.
Figure 4.
Figure 4.
Expression of conditional dominant-negative Atcdc48A mutants. A, Time course of transgenic ethanol-induced H6T7-Atcdc48 mutant protein expression. Expression of H6T7-AtCDC48A (H6T7-WT; lanes 1–3), H6T7-Atcdc48DN-B (H6T7-DN-B; lanes 4–6), and H6T7-Atcdc48DN-H (H6T7-DN-H; lanes 7–9) proteins was monitored by SDS-PAGE and immunoblot analysis using an anti-T7 antibody (top) and an anti-HSP70 antibody as a protein load control (bottom). Seedling samples were prepared prior to ethanol treatment (lanes 1, 4, and 7) or after 6 h (lanes 2, 5, and 8) or 24 h (lanes 3, 6, and 9) post-ethanol treatment. B, Immunoblot analysis of endogenous AtCDC48 and H6T7-AtCDC48A protein expression levels from untransformed (Col2, lane 1) and independent transgenic ethanol-induced wild-type H6T7-AtCDC48A (H6T7-WT; lanes 2 and 3), H6T7-Atcdc48ADN-H (H6T7-DN-H; lanes 4 and 5), and H6T7-Atcdc48ADN-B (H6T7-DN-B; lanes 6 and 7). Segments correspond to probing of samples with anti-AtCDC48A (top), anti-T7 (middle), and anti-DRP1A (bottom, load control). Samples were processed and analyzed at 48 h postinduction. C, Reverse transcription-PCR analysis of H6T7-AtCDC48A and H6T7-Atcdc48ADN gene expression. cDNA was synthesized from total RNA from H6T7-AtCDC48A (H6T7-WT; lanes 1–4), H6T7-Atcdc48DN-B (H6T7-DN-B; lanes 5–8), and H6T7-Atcdc48DN-H (H6T7-DN-H; lanes 9–12) isolated prior to ethanol treatment (lanes 1, 5, and 9) or after 2 h (lanes 2, 6, and 10), 6 h (lanes 3, 7, and 11), or 24 h (lanes 4, 8, and 12) post-ethanol treatment. cDNA fragments were PCR amplified using primers specific to the transgene (top) or the ubiquitin control (bottom).
Figure 5.
Figure 5.
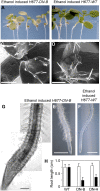
Phenotypic analysis of conditional Atcdc48ADN mutant plants. Five-day-old H6T7-Atcdc48ADN-B (H6T7-DN-B; A, C, E, and G) and H6T7-AtCDC48A (H6T7-WT; B, D, and F) seedlings were treated with 2% (v/v) ethanol and imaged after 4 d. A and B, Stereo micrographs of the aerial portion of ethanol-treated H6T7-DN-B (A) and H6T7-WT (B) plants. C and D, SEM of primary leaves and trichomes from ethanol-treated H6T7-DN-B (C) and H6T7-WT (D) plants. Scale bar = 200 μm. E and F, Stereo micrographs of roots from ethanol-treated H6T7-DN-B (E) and H6T7-WT (F) plants. Scale bar = 0.5 mm. G, Higher magnification DIC image composite of an ethanol-treated H6T7-DN-B seedling root. Scale bar = 50 μm. H, Total seedling root growth for H6T7-WT (WT) and H6T7-Atcdc48ADN mutants (ATP binding: DN-B, and ATP hydrolysis: DN-H) was measured after 4 d post-ethanol (black bars) or mock (white bars) treatment. The data represent a minimum sample size of 25 plants for each construct. The sd is represented as error bars for each group.
Figure 6.
Figure 6.
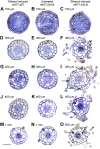
Cell division and trichoblast differentiation are affected in conditional Atcdc48ADN-B mutant H6T7-AtCDC48A (H6T7-WT; column 1) and H6T7-Atcdc48ADN-B (H6T7-DN-B; columns 2 and 3) seedlings were analyzed 4 d after 2% (v/v) ethanol (columns 1 and 3) or mock treatment (column 2). Sections were stained with toluidine blue O and imaged by bright-field microscopy. Figure rows correspond to similar distances of tissue sections from the root tip. A root guide is available in Supplemental Figure S6. A to C, Approximately 100 μm above the root tip. D to F, Approximately 300 μm above the root tip corresponding to the division zone. G to I, Approximately 350 μm above the root tip corresponding to the division-expansion transition zone. J to L, Approximately 400 to 450 μm above the root tip corresponding to the expansion zone. M to O, Approximately 500 to 1,000 μm from the root tip corresponding to the expansion-differentiation transition zone. Black arrows highlight apparent cytokinesis defects. White arrows highlight aberrant cell divisions. Black arrowheads indicate root hairs emerging from inappropriate epidermal cells. White arrowheads highlight root hair projections. Scale bars = 50 μm.

Similar articles

Cited by

References

    1. Acharya U, Jacobs R, Peters JM, Watson N, Farquhar MG, Malhotra V (1995) The formation of Golgi stacks from vesiculated Golgi membranes requires two distinct fusion events. Cell 82 895–904 - PubMed
    1. Aker J, Borst JW, Karlova R, de Vries S (2006) The Arabidopsis thaliana AAA protein CDC48A interacts in vivo with the somatic embryogenesis receptor-like kinase 1 receptor at the plasma membrane. J Struct Biol 156 62–71 - PubMed
    1. Aker J, Hesselink R, Engel R, Karlova R, Borst JW, Visser AJ, de Vries SC (2007) In vivo hexamerization and characterization of the Arabidopsis AAA ATPase CDC48A complex using forster resonance energy transfer-fluorescence lifetime imaging microscopy and fluorescence correlation spectroscopy. Plant Physiol 145 339–350 - PMC - PubMed
    1. Alonso JM, Stepanova AN, Leisse TJ, Kim CJ, Chen H, Shinn P, Stevenson DK, Zimmerman J, Barajas P, Cheuk R, et al (2003) Genome-wide insertional mutagenesis of Arabidopsis thaliana. Science 301 653–657 - PubMed
    1. Alzayady KJ, Panning MM, Kelley GG, Wojcikiewicz RJ (2005) Involvement of the p97-Ufd1-Npl4 complex in the regulated endoplasmic reticulum-associated degradation of inositol 1,4,5-trisphosphate receptors. J Biol Chem 280 34530–34537 - PMC - PubMed

Publication types

Substances

LinkOut - more resources