

Multiparameter flow cytometric analysis of CD4 and CD8 T cell subsets in young and old people
- PMID: 18657274
- PMCID: PMC2515281
- DOI: 10.1186/1742-4933-5-6
Multiparameter flow cytometric analysis of CD4 and CD8 T cell subsets in young and old people
Abstract
Background: T cell-mediated immunity in elderly people is compromised in ways reflected in the composition of the peripheral T cell pool. The advent of polychromatic flow cytometry has made analysis of cell subsets feasible in unprecedented detail.
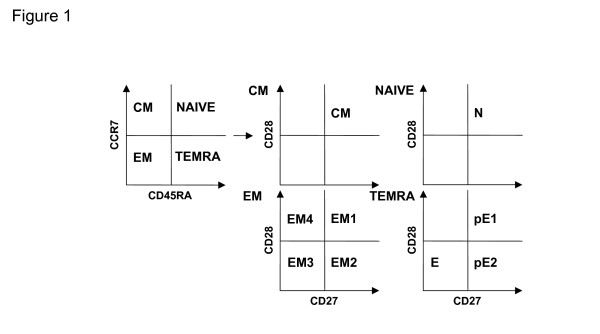
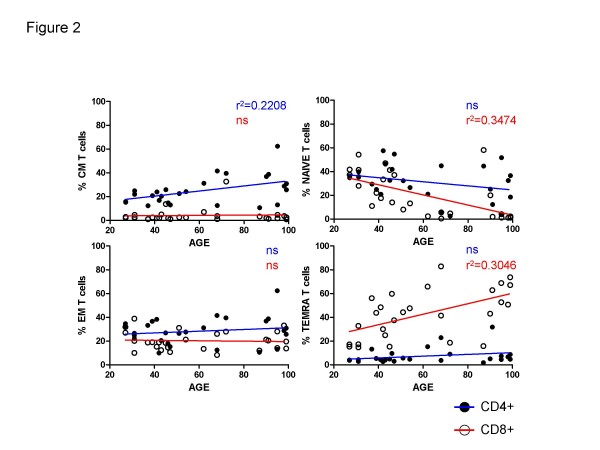
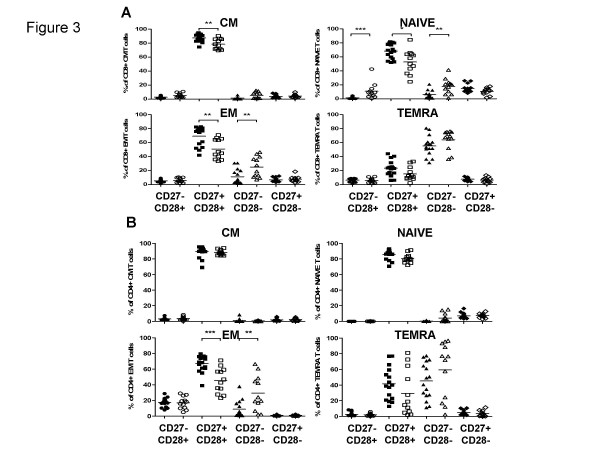
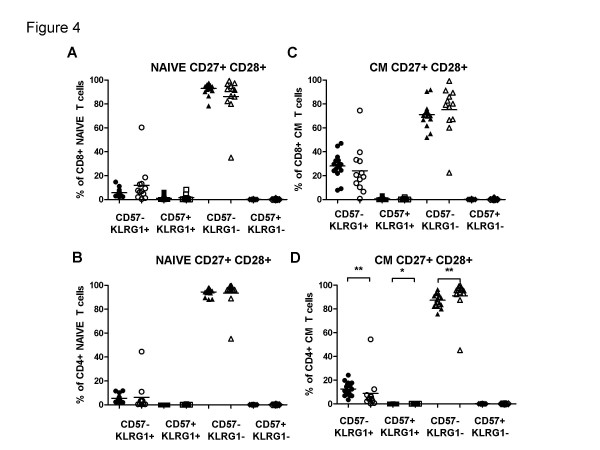
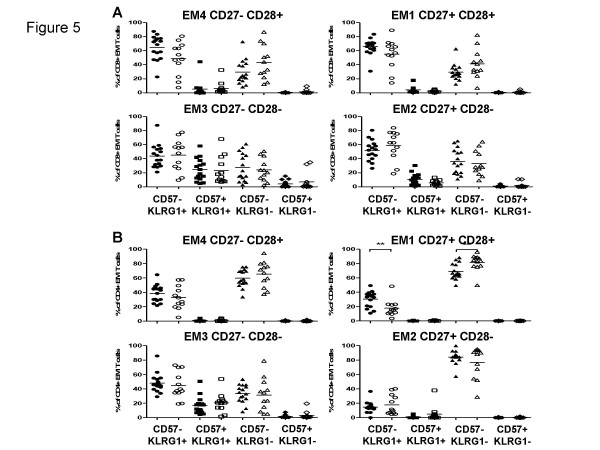
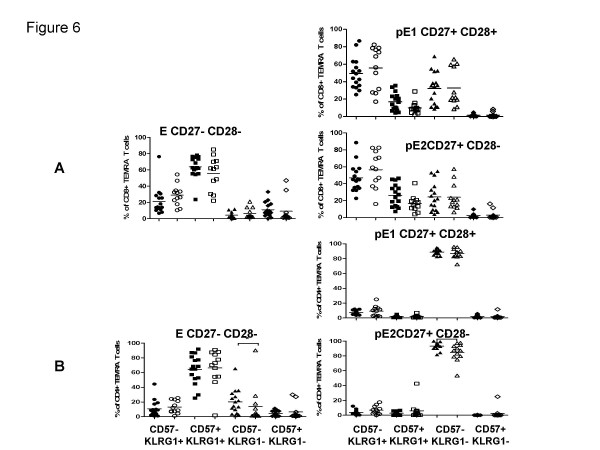
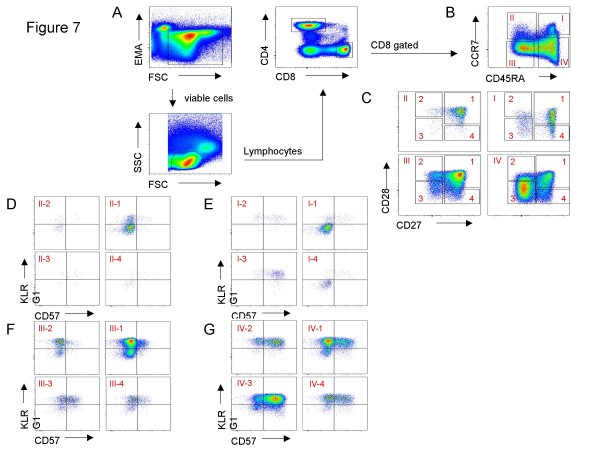
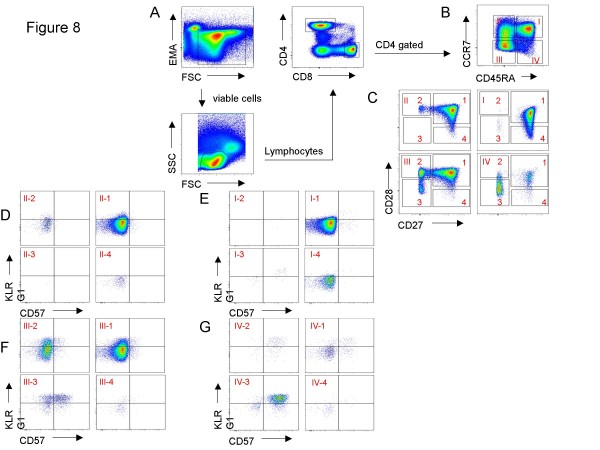
Results: Here we document shifts in subset distribution within naïve (N), central memory (CM) and effector memory (EM) cells defined by CD45RA and CCR7 expression in the elderly, additionally using the costimulatory receptors CD27 and CD28, as well as the coinhibitory receptors CD57 and KLRG-1, to further dissect these. Although differences between young and old were more marked in CD8 than in CD4 cells, a similar overall pattern prevailed in both. Thus, the use of all these markers together, and inclusion of assays of proliferation and cytokine secretion, may enable the construction of a differentiation scheme applicable to CD4 as well as CD8 cells, with the model (based on Romero et al.) suggesting the progression N-->CM-->EM1-->EM2-->pE1-->pE2-->EM4-->EM3-->E end-stage non-proliferative effector cells.
Conclusion: Overall, the results suggest that both differences in subset distribution and differences between subsets are responsible for age-related changes in CD8 cells but that differences within rather than between subsets are more prominent for CD4 cells.
Figures
Similar articles
-
Phenotypic classification of human CD4+ T cell subsets and their differentiation.Int Immunol. 2008 Sep;20(9):1189-99. doi: 10.1093/intimm/dxn075. Epub 2008 Jul 17. Int Immunol. 2008. PMID: 18635582
-
CD45RA-Foxp3(high) activated/effector regulatory T cells in the CCR7 + CD45RA-CD27 + CD28+central memory subset are decreased in peripheral blood from patients with rheumatoid arthritis.Biochem Biophys Res Commun. 2013 Sep 6;438(4):778-83. doi: 10.1016/j.bbrc.2013.05.120. Epub 2013 Jun 6. Biochem Biophys Res Commun. 2013. PMID: 23747721
-
Characterization of transitional memory CD4+ and CD8+ T-cell mobilization during and after an acute bout of exercise.Front Sports Act Living. 2023 Apr 17;5:1120454. doi: 10.3389/fspor.2023.1120454. eCollection 2023. Front Sports Act Living. 2023. PMID: 37139298 Free PMC article.
-
Differentiation of human CD8(+) T cells from a memory to memory/effector phenotype.J Immunol. 2002 Jun 1;168(11):5538-50. doi: 10.4049/jimmunol.168.11.5538. J Immunol. 2002. PMID: 12023349
-
Comprehensive Mass Cytometry Analysis of Cell Cycle, Activation, and Coinhibitory Receptors Expression in CD4 T Cells from Healthy and HIV-Infected Individuals.Cytometry B Clin Cytom. 2017 Jan;92(1):21-32. doi: 10.1002/cyto.b.21502. Cytometry B Clin Cytom. 2017. PMID: 27997758 Review.
Cited by
-
Characteristics of circulating immune cells in HBV-related acute-on-chronic liver failure following artificial liver treatment.BMC Immunol. 2023 Nov 25;24(1):47. doi: 10.1186/s12865-023-00579-8. BMC Immunol. 2023. PMID: 38007423 Free PMC article.
-
Cancer and Aging: Two Tightly Interconnected Biological Processes.Cancers (Basel). 2021 Mar 19;13(6):1400. doi: 10.3390/cancers13061400. Cancers (Basel). 2021. PMID: 33808654 Free PMC article. Review.
-
Mitochondrial mass governs the extent of human T cell senescence.Aging Cell. 2020 Feb;19(2):e13067. doi: 10.1111/acel.13067. Epub 2019 Dec 2. Aging Cell. 2020. PMID: 31788930 Free PMC article.
-
Age-associated phenotypic imbalance in TCD4 and TCD8 cell subsets: comparison between healthy aged, smokers, COPD patients and young adults.Immun Ageing. 2022 Feb 14;19(1):9. doi: 10.1186/s12979-022-00267-y. Immun Ageing. 2022. PMID: 35164774 Free PMC article.
-
Immunotherapeutics in Multiple Myeloma: How Can Translational Mouse Models Help?J Oncol. 2019 Apr 10;2019:2186494. doi: 10.1155/2019/2186494. eCollection 2019. J Oncol. 2019. PMID: 31093282 Free PMC article. Review.
References
LinkOut - more resources
Full Text Sources
Other Literature Sources
Research Materials
