. 2008 Oct;19(10):4154-66.
doi: 10.1091/mbc.e08-05-0513. Epub 2008 Jul 23.

The dynamics of mammalian P body transport, assembly, and disassembly in vivo

Affiliations

The dynamics of mammalian P body transport, assembly, and disassembly in vivo

Adva Aizer et al. Mol Biol Cell. 2008 Oct.

Abstract

Exported mRNAs are targeted for translation or can undergo degradation by several decay mechanisms. The 5'-->3' degradation machinery localizes to cytoplasmic P bodies (PBs). We followed the dynamic properties of PBs in vivo and investigated the mechanism by which PBs scan the cytoplasm. Using proteins of the decapping machinery, we asked whether PBs actively scan the cytoplasm or whether a diffusion-based mechanism is sufficient. Live-cell imaging showed that PBs were anchored mainly to microtubules. Quantitative single-particle tracking demonstrated that most PBs exhibited spatially confined motion dependent on microtubule motion, whereas stationary PB pairs were identified at the centrosome. Some PBs translocated in long-range movements on microtubules. PB mobility was compared with mitochondria, endoplasmic reticulum, peroxisomes, SMN bodies, and stress granules, and diffusion coefficients were calculated. Disruption of the microtubule network caused a significant reduction in PB mobility together with an induction of PB assembly. However, FRAP measurements showed that the dynamic flux of assembled PB components was not affected by such treatments. FRAP analysis showed that the decapping enzyme Dcp2 is a nondynamic PB core protein, whereas Dcp1 proteins continuously exchanged with the cytoplasm. This study reveals the mechanism of PB transport, and it demonstrates how PB assembly and disassembly integrate with the presence of an intact cytoskeleton.


Figures
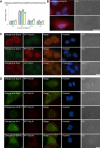
Figure 1.
Figure 1.
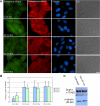
Quantification and distribution of endogenous and XFP-Dcp PBs. (A) Counting of endogenous PBs in U2OS cells and XFP-Dcp PBs in stable cell lines (n = 50 cells; numbers above bars represent percentages). (B) Although most cells have between three and nine PBs (endogenous hDcp1a; red) of varying sizes, some cells can have less (top) or many more PBs (bottom). Hoechst DNA counterstain (blue) and DIC. (C) PBs in the different stable cell lines expressing XFP-Dcp proteins contained both the endogenous and exogenous proteins and (D) other endogenous PB proteins. Bar, 20 μm.
Figure 2.
Figure 2.
Live-cell imaging and single particle tracking of PBs. (A) RFP-Dcp1b PBs were imaged in living cells (60 frames; total 2 min). The first acquired frame is presented and the subsequent tracks from 60 frames of three PBs are annotated (green). The tracks and relative areas (in pixels) in which the PBs moved are plotted. (B) Summary of the distribution of the confined areas of movement for GFP-Dcp1a (n = 211 PBs), RFP-Dcp1b (n = 199), GFP-Dcp2 (n = 186) PBs imaged as described above. (C) Two examples of MSD analysis, depicting plots of a RFP-Dcp1b PB that exhibited confined motion (top) or moved in a directional manner (bottom). (D) Cytoplasmic tracks of RFP-Dcp1b PBs exhibiting directional movement (pink, red, and cyan tracks) or restricted movement (green) (Supplemental Video 3). The blue track shows a mixture of the two types of movement, with a back and forth directed movement on the same track. (E) A frame from a time-lapse movie showing the track of a PB moving along the nuclear periphery (Supplemental Video 4). Bar, 10 μm.
Figure 3.
Figure 3.
PBs associate with the cytoskeleton. (A) The tracks of nine PBs show restricted movement with occasional directed motion occurring in the direction of the nucleus. Bar, 10 μm. (See Supplemental Video 6.) (B) RFP-Dcp1b–labeled PBs did not show any movement when associated with GFP-actin bundles (Supplemental Video 7). Two regions are enlarged and PBs tracked: 1) mobile PBs not connected to actin (red track; 30 frames) and 2) stationary PBs associated with an actin bundle (blue track; 30 frames). (C) The movement of PBs is due to their association with microtubules (Supplemental Video 8). 1 and 2, two subsequent frames showing the downward movement of a microtubule (yellow line) and an associated PB (pink). The other two PBs are colored yellow and cyan to ease their identification in the images. 3 and 4, two examples of multiple PBs associated with microtubules. (D) Directed movement of a PB on a microtubule toward the nucleus, and a change in direction when reaching the region of the nuclear membrane. Bar, 2 μm. (E) Directed movement of a PB on a microtubule above the nucleus showing track portions in which the PB is stationary and portions when the PB is moving on the microtubule. During the second stretch the PB changes the microtubule track it is moving on (Supplemental Video 9).
Figure 4.
Figure 4.
PBs can associate with the microtubule organizing center. (A) RFP-Dcp1b cells were transfected with GFP-tubulin. The tracks of four PBs are shown. Although the two PBs in the peripheral cytoplasm were dynamic (regions 2 and 3; cyan tracks), the two PBs at the microtubule junction above the nucleus were stationary (region 1; red and green tracks) (Supplemental Video 10). (B) RFP-Dcp1b cells were coimmunostained with antibodies to endogenous γ-tubulin (blue) and Dcp1a (green). The Dcp1a and 1b signals colocalized and were adjacent to the centrosome. (C) RFP-Dcp1b cells transfected with GFP-centrin. The two PBs were adjacent to the centrosome. Bar, 10 μm.
Figure 5.
Figure 5.
Disruption of the microtubule network reduces PB mobility. (A) RFP-Dcp1b PBs (red) were imaged in cells expressing GFP-tubulin (green) before and after nocodazole treatment (30, 60, and 90 min after treatment). The white demarcations show a PB and the track of the same PB during this period. Before treatment the track (green) covers a confined but relatively large area. After destabilization of the microtubule network the tracks show a major reduction in PB motion (Supplemental Video 11). Bar, 10 μm. (B) Box-plot of measurements from tracked PBs: GFP-Dcp1a (n = 427; median untreated = 1.91, noc = 0.21 μm2), RFP-Dcp1b (n = 318; median untreated = 1.5, noc = 0.6 μm2), GFP-Dcp2 (n = 391; median untreated = 1.9, noc = 0.55 μm2), showing the distribution of tracked areas, and a reduction in the areas monitored by PBs after treatment with nocodazole (median, horizontal line). This type of single-cell analysis is probably the reason for the variations observed in between the cell lines. (C) Distribution of the calculated diffusion coefficients (μm2/sec) of the tracked RFP-Dcp1b PBs before (blue) and after treatments (green, nocodazole; yellow, vinblastine).
Figure 6.
Figure 6.
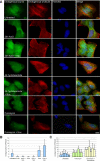
Disruption of the microtubule network causes an increase in PB numbers. (A) U2OS cells treated with nocodazole were fixed at different time points after treatment and costained with anti-hDcp1a (green) and anti-α-tubulin (red) antibodies. DNA was counterstained with Hoechst (blue) and cells were imaged also in differential interference contrast (DIC). Bar, 20 μm. (B) The increase in PB numbers per cell was quantified by counting 20 cells. Error bars indicate SD. (C) Western blot analysis of cell extracts from cells before and during nocodazole treatment, blotted with anti-hDcp1a and with anti-α-tubulin for quantification.
Figure 7.
Figure 7.
PB assembly/disassembly after inhibition of transcription and translation. (A) Endogenous hDcp1b (green), α-tubulin (red), DNA (blue), and DIC images show that after inhibition of transcription (ActD) or translation (cycloheximide) PBs disassembled. No increase in PBs was found in conjunction with microtubule disruption by nocodazole. However, during puromycin treatment that releases mRNA from polysomes, PBs did not disassemble and increased in number and size together with nocodazole treatment. Bar, 10 μm. (B) Counting of PBs in 20 U2OS cells before and after the different treatments. (C) The average number of PBs in random populations of cells before and after puromycin (± nocodazole) treatment. Error bars indicate SD.
Figure 8.
Figure 8.
PB-assembled Dcp proteins exhibit different exchange kinetics. FRAP recovery curves for GFP-Dcp1a (A), GFP-Dcp1b (B), and GFP-Dcp2 (C). Left, untreated control cells (green curves depict the fast recovery of the diffusing cytoplasmic pool). Middle, nocodazole treated. Right, puromycin treated. Error bars indicate SD.

Similar articles

Cited by

References

    1. Alliegro M. C., Alliegro M. A., Palazzo R. E. Centrosome-associated RNA in surf clam oocytes. Proc. Natl. Acad. Sci. USA. 2006;103:9034–9038. - PMC - PubMed
    1. Andrei M. A., Ingelfinger D., Heintzmann R., Achsel T., Rivera-Pomar R., Luhrmann R. A role for eIF4E and eIF4E-transporter in targeting mRNPs to mammalian processing bodies. RNA. 2005;11:717–727. - PMC - PubMed
    1. Bashkirov V. I., Scherthan H., Solinger J. A., Buerstedde J. M., Heyer W. D. A mouse cytoplasmic exoribonuclease (mXRN1p) with preference for G4 tetraplex substrates. J. Cell Biol. 1997;136:761–773. - PMC - PubMed
    1. Beelman C. A., Stevens A., Caponigro G., LaGrandeur T. E., Hatfield L., Fortner D. M., Parker R. An essential component of the decapping enzyme required for normal rates of mRNA turnover. Nature. 1996;382:642–646. - PubMed
    1. Behm-Ansmant I., Rehwinkel J., Doerks T., Stark A., Bork P., Izaurralde E. mRNA degradation by miRNAs and GW182 requires both CCR4:NOT deadenylase and DCP1:DCP2 decapping complexes. Genes Dev. 2006;20:1885–1898. - PMC - PubMed

Publication types

Substances

LinkOut - more resources