Genome-wide analysis of transposon insertion polymorphisms reveals intraspecific variation in cultivated rice
- PMID: 18650402
- PMCID: PMC2528094
- DOI: 10.1104/pp.108.121491
Genome-wide analysis of transposon insertion polymorphisms reveals intraspecific variation in cultivated rice
Abstract
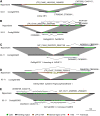
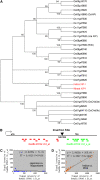
Insertions and precise eliminations of transposable elements generated numerous transposon insertion polymorphisms (TIPs) in rice (Oryza sativa). We observed that TIPs represent more than 50% of large insertions and deletions (>100 bp) in the rice genome. Using a comparative genomic approach, we identified 2,041 TIPs between the genomes of two cultivars, japonica Nipponbare and indica 93-11. We also identified 691 TIPs between Nipponbare and indica Guangluai 4 in the 23-Mb collinear regions of chromosome 4. Among them, retrotransposon-based insertion polymorphisms were used to reveal the evolutionary relationships of these three cultivars. Our conservative estimates suggest that the TIPs generated approximately 14% of the genomic DNA sequence differences between subspecies indica and japonica. It was also found that more than 10% of TIPs were located in expressed gene regions, representing an important source of genetic variation. Transcript evidence implies that these TIPs induced a series of genetic differences between two subspecies, including interrupting host genes, creating different expression forms, drastically changing intron length, and affecting expression levels of adjacent genes. These analyses provide genome-wide insights into evolutionary history and genetic variation of rice.
Figures


Similar articles
-
Polymorphisms and evolutionary history of retrotransposon insertions in rice promoters.Genome. 2011 Aug;54(8):629-38. doi: 10.1139/g11-030. Epub 2011 Aug 8. Genome. 2011. PMID: 21823826
-
Diversity of the Ty-1 copia retrotransposon Tos17 in rice (Oryza sativa L.) and the AA genome of the Oryza genus.Mol Genet Genomics. 2009 Dec;282(6):633-52. doi: 10.1007/s00438-009-0493-z. Epub 2009 Oct 25. Mol Genet Genomics. 2009. PMID: 19856189
-
Exceptional lability of a genomic complex in rice and its close relatives revealed by interspecific and intraspecific comparison and population analysis.BMC Genomics. 2011 Mar 8;12:142. doi: 10.1186/1471-2164-12-142. BMC Genomics. 2011. PMID: 21385395 Free PMC article.
-
A collection of 10,096 indica rice full-length cDNAs reveals highly expressed sequence divergence between Oryza sativa indica and japonica subspecies.Plant Mol Biol. 2007 Nov;65(4):403-15. doi: 10.1007/s11103-007-9174-7. Epub 2007 May 24. Plant Mol Biol. 2007. PMID: 17522955
-
Genome-wide intraspecific DNA-sequence variations in rice.Curr Opin Plant Biol. 2003 Apr;6(2):134-8. doi: 10.1016/s1369-5266(03)00004-9. Curr Opin Plant Biol. 2003. PMID: 12667869 Review.
Cited by
-
Methods for accurate quantification of LTR-retrotransposon copy number using short-read sequence data: a case study in Sorghum.Mol Genet Genomics. 2016 Oct;291(5):1871-83. doi: 10.1007/s00438-016-1225-9. Epub 2016 Jun 13. Mol Genet Genomics. 2016. PMID: 27295958
-
Transposable elements in phytopathogenic Verticillium spp.: insights into genome evolution and inter- and intra-specific diversification.BMC Genomics. 2012 Jul 16;13:314. doi: 10.1186/1471-2164-13-314. BMC Genomics. 2012. PMID: 22800085 Free PMC article.
-
AthCNV: A Map of DNA Copy Number Variations in the Arabidopsis Genome.Plant Cell. 2020 Jun;32(6):1797-1819. doi: 10.1105/tpc.19.00640. Epub 2020 Apr 7. Plant Cell. 2020. PMID: 32265262 Free PMC article.
-
High potential of a transposon mPing as a marker system in japonica x japonica cross in rice.DNA Res. 2009 Apr;16(2):131-40. doi: 10.1093/dnares/dsp004. Epub 2009 Mar 6. DNA Res. 2009. PMID: 19270311 Free PMC article.
-
Molecular characterization of a rice mutator-phenotype derived from an incompatible cross-pollination reveals transgenerational mobilization of multiple transposable elements and extensive epigenetic instability.BMC Plant Biol. 2009 May 29;9:63. doi: 10.1186/1471-2229-9-63. BMC Plant Biol. 2009. PMID: 19476655 Free PMC article.
References
-
- Batzer MA, Deininger PL (2002) Alu repeats and human genomic diversity. Nat Rev Genet 3 370–379 - PubMed
-
- Bennetzen JL (2000) Transposable element contributions to plant gene and genome evolution. Plant Mol Biol 42 251–269 - PubMed
-
- Bergman CM, Quesneville H (2007) Discovering and detecting transposable elements in genome sequences. Brief Bioinform 8 382–392 - PubMed
Publication types
MeSH terms
Substances
LinkOut - more resources
Full Text Sources
Miscellaneous

