

High glucose induces toll-like receptor expression in human monocytes: mechanism of activation
- PMID: 18650365
- PMCID: PMC2570406
- DOI: 10.2337/db08-0564
High glucose induces toll-like receptor expression in human monocytes: mechanism of activation
Abstract
Objective: Hyperglycemia-induced inflammation is central in diabetes complications, and monocytes are important in orchestrating these effects. Toll-like receptors (TLRs) play a key role in innate immune responses and inflammation. However, there is a paucity of data examining the expression and activity of TLRs in hyperglycemic conditions. Thus, in the present study, we examined TLR2 and TLR4 mRNA and protein expression and mechanism of their induction in monocytic cells under high-glucose conditions.
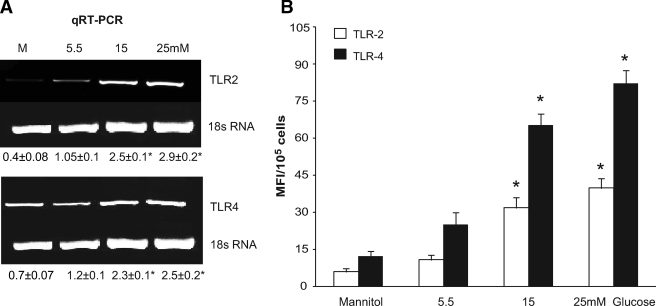
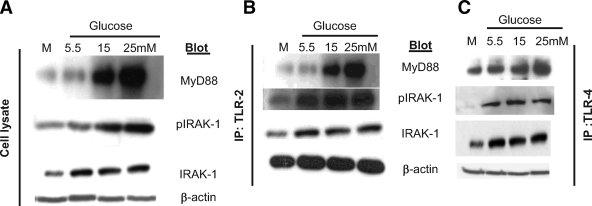
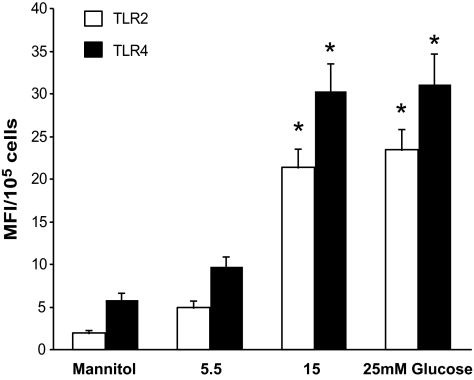
Research design and methods: High glucose (15 mmol/l) significantly induced TLR2 and TLR4 expression in THP-1 cells in a time- and dose-dependent manner (P < 0.05). High glucose increased TLR expression, myeloid differentiation factor 88, interleukin-1 receptor-associated kinase-1, and nuclear factor-kappaB (NF-kappaB) p65-dependent activation in THP-1 cells. THP-1 cell data were further confirmed using freshly isolated monocytes from healthy human volunteers (n = 10).
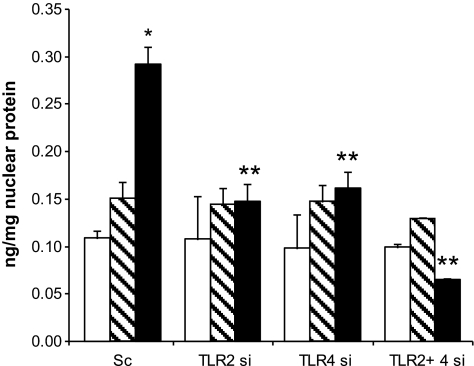
Results: Pharmacological inhibition of protein kinase C (PKC) activity and NADPH oxidase significantly decreased TLR2 and TLR4 mRNA and protein (P < 0.05). Knocking down both TLR2 and TLR4 in the cells resulted in a 76% (P < 0.05) decrease in high-glucose-induced NF-kappaB activity, suggesting an additive effect. Furthermore, PKC-alpha knockdown decreased TLR2 by 61% (P < 0.05), whereas inhibition of PKC-delta decreased TLR4 under high glucose by 63% (P < 0.05). Small inhibitory RNA to p47Phox in THP-1 cells abrogated high-glucose-induced TLR2 and TLR4 expression. Additional studies revealed that PKC-alpha, PKC-delta, and p47Phox knockdown significantly abrogated high-glucose-induced NF-kappaB activation and inflammatory cytokine secretion.
Conclusions: Collectively, these data suggest that high glucose induces TLR2 and -4 expression via PKC-alpha and PKC-delta, respectively, by stimulating NADPH oxidase in human monocytes.
Figures
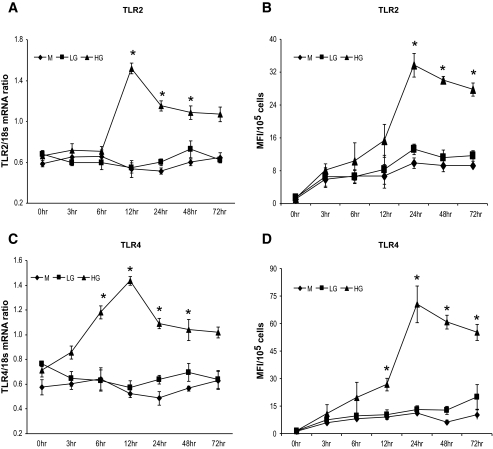
 , LG (5.5 mmol/l); ▪, HG (15 mmol/l).
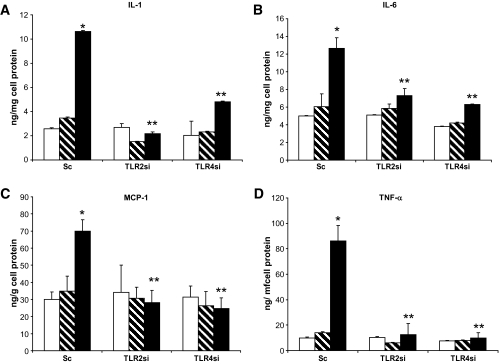 , LG (5.5 mmol/l); ▪, HG (15 mmol/l).
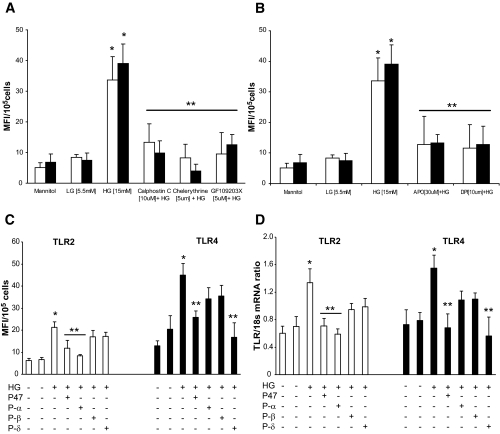
Similar articles
-
Free fatty acids in the presence of high glucose amplify monocyte inflammation via Toll-like receptors.Am J Physiol Endocrinol Metab. 2011 Jan;300(1):E145-54. doi: 10.1152/ajpendo.00490.2010. Epub 2010 Oct 19. Am J Physiol Endocrinol Metab. 2011. PMID: 20959532 Free PMC article.
-
Increased toll-like receptor (TLR) activation and TLR ligands in recently diagnosed type 2 diabetic subjects.Diabetes Care. 2010 Apr;33(4):861-8. doi: 10.2337/dc09-1799. Epub 2010 Jan 12. Diabetes Care. 2010. PMID: 20067962 Free PMC article.
-
Sulfur Compounds Inhibit High Glucose-Induced Inflammation by Regulating NF-κB Signaling in Human Monocytes.Molecules. 2020 May 17;25(10):2342. doi: 10.3390/molecules25102342. Molecules. 2020. PMID: 32429534 Free PMC article.
-
A Review: The Significance of Toll-Like Receptors 2 and 4, and NF-κB Signaling in Endothelial Cells during Atherosclerosis.Front Biosci (Landmark Ed). 2024 Apr 23;29(4):161. doi: 10.31083/j.fbl2904161. Front Biosci (Landmark Ed). 2024. PMID: 38682207 Review.
-
The regulatory role of Toll-like receptors after ischemic stroke: neurosteroids as TLR modulators with the focus on TLR2/4.Cell Mol Life Sci. 2019 Feb;76(3):523-537. doi: 10.1007/s00018-018-2953-2. Epub 2018 Oct 30. Cell Mol Life Sci. 2019. PMID: 30377701 Free PMC article. Review.
Cited by
-
Combined All-Extremity High-Intensity Interval Training Regulates Immunometabolic Responses through Toll-Like Receptor 4 Adaptors and A20 Downregulation in Obese Young Females.Obes Facts. 2020;13(3):415-431. doi: 10.1159/000509132. Epub 2020 Jul 2. Obes Facts. 2020. PMID: 32615574 Free PMC article.
-
Immunity and inflammation in diabetic kidney disease: translating mechanisms to biomarkers and treatment targets.Am J Physiol Renal Physiol. 2017 Apr 1;312(4):F716-F731. doi: 10.1152/ajprenal.00314.2016. Epub 2016 Aug 24. Am J Physiol Renal Physiol. 2017. PMID: 27558558 Free PMC article. Review.
-
Heart Failure in Type 2 Diabetes Mellitus.Circ Res. 2019 Jan 4;124(1):121-141. doi: 10.1161/CIRCRESAHA.118.311371. Circ Res. 2019. PMID: 30605420 Free PMC article. Review.
-
Differential effects of cream, glucose, and orange juice on inflammation, endotoxin, and the expression of Toll-like receptor-4 and suppressor of cytokine signaling-3.Diabetes Care. 2010 May;33(5):991-7. doi: 10.2337/dc09-1630. Epub 2010 Jan 12. Diabetes Care. 2010. PMID: 20067961 Free PMC article. Clinical Trial.
-
Mulberry leaf reduces inflammation and insulin resistance in type 2 diabetic mice by TLRs and insulin Signalling pathway.BMC Complement Altern Med. 2019 Nov 21;19(1):326. doi: 10.1186/s12906-019-2742-y. BMC Complement Altern Med. 2019. PMID: 31752797 Free PMC article.
References
-
- Ruderman NB, Haudenschild C: Diabetes as an atherogenic factor. Prog Cardiovasc Dis 26: 373–412, 1984 - PubMed
-
- Nathan DM, Cleary PA, Backlund JY, Genuth SM, Lachin JM, Orchard TJ, Raskin P, Zinman B, the Diabetes Control and Complications Trial/Epidemiology of Diabetes Interventions and Complications (DCCT/EDIC) Study Research Group: Intensive diabetes treatment and cardiovascular disease in patients with type 1 diabetes. N Engl J Med 353: 2643–2653, 2005 - PMC - PubMed
-
- Haffner SM, Lehto S, Ronnemaa T, Pyorala K, Laakso M: Mortality from coronary heart disease in subjects with type 2 diabetes and in nondiabetic subjects with and without prior myocardial infarction. N Engl J Med 339: 229–234, 1998 - PubMed
-
- Schram MT, Chaturvedi N, Schalkwijk C, Giorgino F, Ebeling P, Fuller JH, Stehouwer CD, the EURODIAB Prospective Complications Study: Vascular risk factors and markers of endothelial function as determinants of inflammatory markers in type 1 diabetes: the EURODIAB Prospective Complications Study. Diabetes Care 26: 2165–2173, 2003 - PubMed
-
- Schalkwijk CG, Poland DC, van Dijk W, Kok A, Emeis JJ, Drager AM, Doni A, van Hinsbergh VW, Stehouwer CD: Plasma concentration of C-reactive protein is increased in type I diabetic patients without clinical macroangiopathy and correlates with markers of endothelial dysfunction: evidence for chronic inflammation. Diabetologia 42: 351–357, 1999 - PubMed
