. 2008 Spring;18(2 Suppl 2):S2-30-7.

Apoptotic peptides derived from HIV-1 Nef induce lymphocyte depletion in mice

Affiliations

Apoptotic peptides derived from HIV-1 Nef induce lymphocyte depletion in mice

Ming-Bo Huang et al. Ethn Dis. 2008 Spring.

Abstract

Introduction: We have developed a mouse model to examine the effects of host exposure (ie, hematopoietic system) to secreted HIV-1 Nef or peptides derived from Nef.

Methods: We used a combination of terminal uridine deoxynucleotidyl transferase (dUTP) nick end labeling (TUNEL) assays and CD4+ cell counts to assess the status of circulating immune cells in mice treated with Nef-derived proteins.

Results: Mice treated with peptides derived from HIV-1 Nef protein displayed significant increases in apoptotic CD4+ lymphocytes and thymus cells and significant decreases in the numbers of circulating CD4+ lymphocytes. No effects were observed in mice treated with controls. There was a clear dose- and time-response relationship between cell changes and the amount of protein or peptide. induction of multiple markers of apoptosis such as DNA laddering and caspase 3 activation was observed during dose- or time-response experiments. Cell death and lymphocyte depletion were blocked by induction of a humoral response to the HIV Nef apoptotic epitope.

Conclusions: Extracellular Nef can induce apoptosis and lymphocyte depletion in vivo. Appropriate antibody response can block these effects, but the apoptotic motifs in Nef are thought to be poorly immunogenic.


Figures
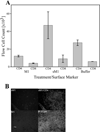
Fig 1
Fig 1
In vivo NefM1-induced changes in CD4+ PBLs. Mice were treated intraperitoneally with Buffer (Buffer, bar represents 2 mice), or 1 µg NefM1 (M1; bar represents 4 mice) or NefsM1 (sM1; bar represents 2 mice) peptide three times a week for 4 weeks. The mice were then sacrificed, total blood was harvested, and peripheral blood lymphocytes (PBLs) collected by gradient isolation. (A) PBLs were fixed, and stained for CD3, CD4, CD8 and analyzed by Fluorescence-activated cell sorting, (FACS) for total CD3+/CD4+, or total CD3+/CD8+ cells. Error bars represent the standard error of measurement. (B) Thymus was harvested, fixed, sectioned, and CD4+/TUNEL stained. Each panel is a representative section image for each category of treatment. The top panels are TUNEL (Fluorescein isothiocyanate, FITC) staining of a thymus section from a NefsM1 treated mouse (sM1; left) or a TUNEL/CD4+ stained (Texas Red) image of the same thymus section (right). The bottom panels are a TUNEL stained thymus section from a NefM1 treated mouse (M1; left); or a transposed TUNEL/CD4+ image of the same thymus section (right). The scale bar at the bottom left represents 10 µ
Fig 2
Fig 2
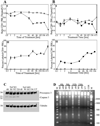
Time Response Analysis of mouse peripheral blood lymphocyte (PBL) population treated in vivo. Mice were treated intraperitoneally with NefM1 (closed circle graphs) or NefsM1 (open circle graphs) for various periods of time. Those mice treated for less than 48 hours were injected once at T = 0. Those treated for more than 48 hours were injected every 48 hours. Then either cell numbers were measured as # treated cells (1–672 hrs)/# untreated cells (UT; A-I, B-I) or percent apoptosis in each PBL population (panel A-II, B-II). Panel A-I and A-II display CD4+ results, and Panels B-I and B-II display CD8+ results. The x-axis displays the treatment time in hours, each point represents a minimum of two mice, and the error bars represent the standard error of measurement. (C) Caspase 3 activation was assayed by Western blot analysis. 20 µg of total protein was loaded per lane. Displayed are PBLs from mice treated with NefM1 for 48, 96, 192, and 336 hours respectively (1–4), or NefsM1 for 48, 96, 192, and 336 hours respectively (5–8), with the last lane being PBLs from untreated mice (UT). Procaspase 3 is the high molecular weight band (32 kD), the large catalytic Caspase 3 active subunit being 17 kD, Tubulin (50 kD) used as the gel-loading control, and prestrained SDS-PAGE Standards (broad range) (BIO-RAD Labs, Hercules, CA) used as molecular weight markers. (D) DNA from PBLs was analyzed for apoptosis characteristic laddering as previously described. From left to right on the image, DNA markers [lane M], NefM1/48 hour treated mice [lane 48h-M1]; NefsM1/48 hour treated mice [lane 48h-sM1]; NefM1/96 hour treated mice [lane 96h-M1]; NefsM1/96 hour treated mice [lane 96h-sM1]; NefM1/192 hour treated mice [lane 192h-M1]; NefsM1/192 hour treated mice [lane 192h-sM1]; NefM1/384 hour treated mice [lane 336h-M1]; NefsM1/384 hour treated mice [lane 336h-sM1]; untreated mice [lane UT]; Ceramide treated Jurkat cell cultures as a positive control [lane CER; 23.4 µM]; markers [lane M]. Each lane is a representation of a minimum of two mice
Fig 3
Fig 3
Dose Response Analysis of mouse peripheral blood lymphocyte (PBL) population treated in vivo. Mice were treated IP every 48 hours with NefM1 for one week at various dosages. Untreated mice [UT]; mice were treated with: 0.5 µg NefM1/mouse, 1.0 µg NefM1/mouse, 2.5 µg NefM1/mouse, 5 µg NefM1/mouse, 10 µg NefM1/mouse, 20 µg NefM1/mouse. Harvested PBLs were fixed and stained for CD3, CD4, and CD8 and analyzed by microscopic examination. (A) PBL populations were assayed for CD4+ cells (black circles), and the CD4+ cells were assayed for apoptosis by TUNEL (grey squares). (B) PBLs population was assayed for CD8+ cells (black circles), and the CD8+ cells were assayed for apoptosis by TUNEL (grey squares). The percentage of labeled cells (either TUNEL labeled, or CD4+ labeled) was plotted as a function of the treatment dosage. Each point represents a minimum of two treated mice, and the error bars represent the standard error of measurement. The identification of the hallmarks of apoptosis as a function of treatment dosage. (C) Caspase 3 activation was assayed by Western analysis with 20 µg of total protein loaded per lane. From left to right on the image: 0.5 µg NefM1/mouse, 1.0 µg NefM1/mouse, 2.5 µg NefM1/mouse, 5 µg NefM1/mouse, 10 µg NefM1/mouse, 20 µg NefM1/mouse, and untreated mice (UT). Procaspase 3 is the high molecular weight band (32 kD), the large catalytic Caspase 3 active subunit being 17 kD, Tubulin (50 kD) used as the gel-loading control, and prestrained SDS-PAGE Standards (broad range) (BIO-RAD Labs, Hercules, CA) used as molecular weight markers. (D) DNA from PBLs was analyzed for apoptosis characteristic laddering as described previously. From left to right, DNA markers [lane M]; 0.5 µg NefM1/mouse, 1.0 µg NefM1/mouse; 2.5 µg NefM1/mouse; 5 µg NefM1/mouse; 10 µg NefM1/mouse; 20 µg NefM1/mouse; untreated mice [lane UT]; Ceramide treated Jurkat cell cultures as a positive control [lane CER; 23.4 µM]; markers [lane M]. Each lane is a representation of a minimum of two mice
Fig 4
Fig 4
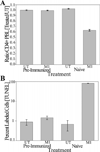
The protective effect of induction of a humoral response against NefM1. A cohort of nine mice was immunized with KLH-NefM1, and a humoral immune response was induced and demonstrated in each mouse. Another cohort of six unimmunized mice was used as a control group. The challenge group (M1) consisted of seven preimmunized mice (pre-immunized panel A-bar M1/PreImmunized and panel B-bar M1/PreImmunized), and five unimmunized mice (Naive; panel A-bar M1/Naive and panel B-bar M1/Naive). they were challenged with three weeks of IP injection treatments every 48 hours with NefM1 (1 µg/mouse). The unchallenged, or negative control group (UT) consisted of two pre-immunized mice (panel A-bar UT/pre-immunized, and panel B-bar UT/pre-immunized), and one unimmunized mouse (panel A-bar UT/Naive and panel B-bar UT/Naïve). All mice were then sacrificed, blood collected, and peripheral blood lymphocytes harvested. (A) Cell numbers from each treatment group that were analyzed for CD4+ phenotype, and displayed as a ratio of the number of cells in the treated population to the total number of cells in the untreated population (UT). (B) The percent of CD4+ cells in each treatment group that were TUNEL labeled

Similar articles

Cited by

References

    1. James CO, Huang MB, Khan M, Garcia-Barrio M, Powell MD, Bond VC. Extracellular Nef protein targets CD4+ T cells for apoptosis by interacting with CXCR4 surface receptors. J Virol. 2004;78:3099–3109. - PMC - PubMed
    1. Huang MB, Jin LL, James CO, Khan M, Powell MD, Bond VC. Characterization of Nef-CXCR4 interactions important for apoptosis induction. J Virol. 2004;78:11084–11096. - PMC - PubMed
    1. Fujii Y, Otake K, Tashiro M, Adachi A. Soluble Nef antigen of HIV-1 is cytotoxic for human CD4+ T cells. FEBS Lett. 1996;393:93–96. - PubMed
    1. Guy B, Riviere Y, Dott K, Regnault A, Kieny MP. Mutational analysis of the HIV Nef protein. Virology. 1990;176:413–425. - PubMed
    1. Addo MM, Yu XG, Rathod A, et al. Comprehensive epitope analysis of human immunodeficiency virus type 1 (HIV-1)-specific T-cell responses directed against the entire expressed HIV-1 genome demonstrate broadly directed responses, but no correlation to viral load. J Virol. 2003;77:2081–2092. - PMC - PubMed

Publication types

Substances

LinkOut - more resources