

Tir8/Sigirr prevents murine lupus by suppressing the immunostimulatory effects of lupus autoantigens
- PMID: 18644972
- PMCID: PMC2525585
- DOI: 10.1084/jem.20072646
Tir8/Sigirr prevents murine lupus by suppressing the immunostimulatory effects of lupus autoantigens
Erratum in
- J Exp Med. 2008 Sep 1;205(9):2179
Abstract
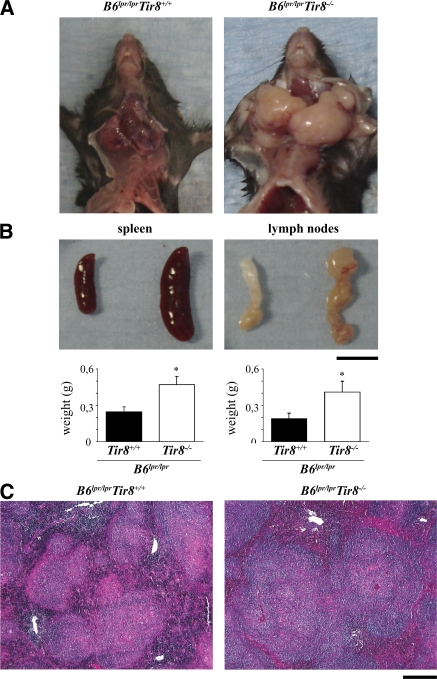
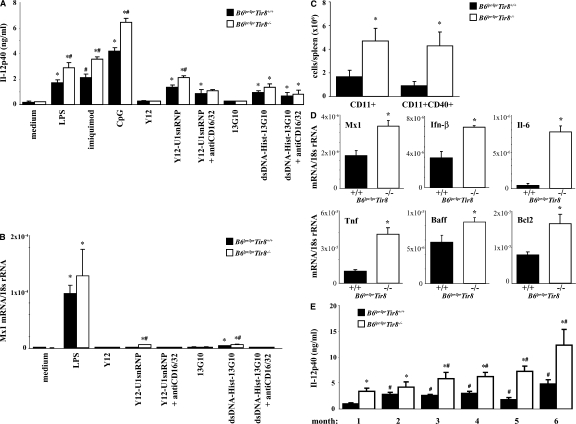
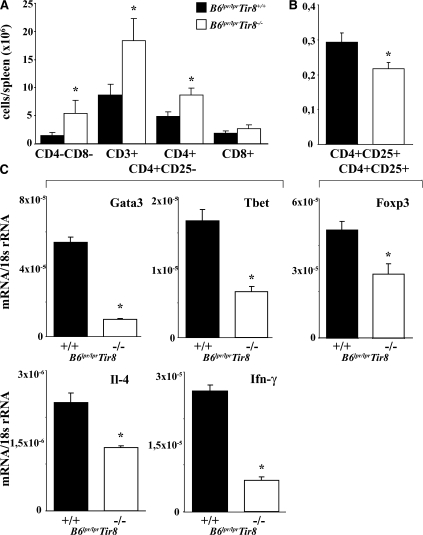
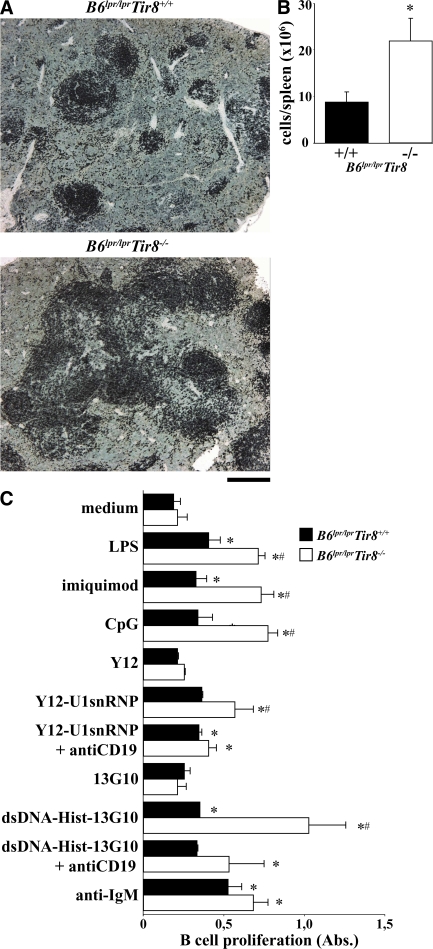
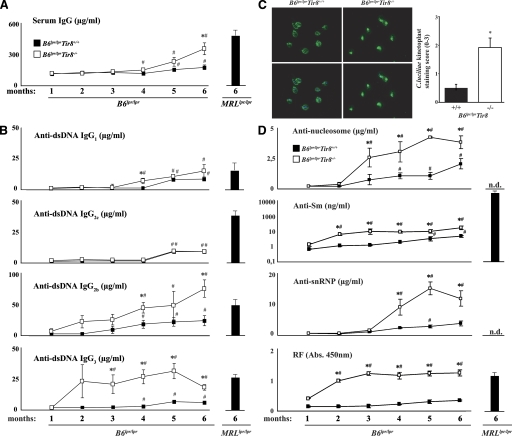
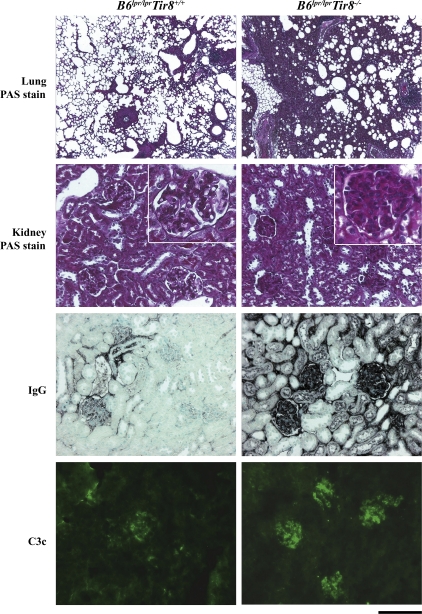
The Sigirr gene (also known as Tir8) encodes for an orphan receptor of the Toll-like receptor (TLR)/interleukin 1 receptor family that inhibits TLR-mediated pathogen recognition in dendritic cells. Here, we show that Sigirr also inhibits the activation of dendritic cells and B cells upon exposure to RNA and DNA lupus autoantigens. To evaluate the functional role of Sigirr in the pathogenesis of systemic lupus erythematosus (SLE), we generated Sigirr-deficient C57BL/6-lpr/lpr mice. These mice developed a progressive lymphoproliferative syndrome followed by severe autoimmune lung disease and lupus nephritis within 6 mo of age as compared with the minor abnormalities observed in C57BL/6-lpr/lpr mice. Lack of Sigirr was associated with enhanced activation of dendritic cells and increased expression of multiple proinflammatory and antiapoptotic mediators. In the absence of Sigirr, CD4 T cell numbers were increased and CD4(+)CD25(+) T cell numbers were reduced. Furthermore, lack of Sigirr enhanced the activation and proliferation of B cells, including the production of autoantibodies against multiple nuclear lupus autoantigens. These data identify Sigirr as a novel SLE susceptibility gene in mice.
Figures
Similar articles
-
Lack of SIGIRR/TIR8 aggravates hydrocarbon oil-induced lupus nephritis.J Pathol. 2010 Apr;220(5):596-607. doi: 10.1002/path.2678. J Pathol. 2010. PMID: 20112371
-
DNA-like class R inhibitory oligonucleotides (INH-ODNs) preferentially block autoantigen-induced B-cell and dendritic cell activation in vitro and autoantibody production in lupus-prone MRL-Fas(lpr/lpr) mice in vivo.Arthritis Res Ther. 2009;11(3):R79. doi: 10.1186/ar2710. Epub 2009 May 28. Arthritis Res Ther. 2009. PMID: 19476613 Free PMC article.
-
Interleukin-1 receptor-associated kinase-M suppresses systemic lupus erythematosus.Ann Rheum Dis. 2011 Dec;70(12):2207-17. doi: 10.1136/ard.2011.155515. Epub 2011 Aug 29. Ann Rheum Dis. 2011. PMID: 21875872
-
The central and multiple roles of B cells in lupus pathogenesis.Immunol Rev. 1999 Jun;169:107-21. doi: 10.1111/j.1600-065x.1999.tb01310.x. Immunol Rev. 1999. PMID: 10450512 Review.
-
Nph, DC and chromatin-mediated pathogenesis in systemic lupus erythematosus.Autoimmunity. 2009 May;42(4):254-6. doi: 10.1080/08916930902827884. Autoimmunity. 2009. PMID: 19811268 Review.
Cited by
-
Decoys and Regulatory "Receptors" of the IL-1/Toll-Like Receptor Superfamily.Front Immunol. 2013 Jul 9;4:180. doi: 10.3389/fimmu.2013.00180. eCollection 2013. Front Immunol. 2013. PMID: 23847621 Free PMC article.
-
Loss of single immunoglobulin interlukin-1 receptor-related molecule leads to enhanced colonic polyposis in Apc(min) mice.Gastroenterology. 2010 Aug;139(2):574-85. doi: 10.1053/j.gastro.2010.04.043. Epub 2010 Apr 21. Gastroenterology. 2010. PMID: 20416302 Free PMC article.
-
Cytokine decoy and scavenger receptors as key regulators of immunity and inflammation.Cytokine. 2016 Nov;87:37-45. doi: 10.1016/j.cyto.2016.06.023. Epub 2016 Aug 4. Cytokine. 2016. PMID: 27498604 Free PMC article.
-
Evidence for a DC-specific inhibitory mechanism that depends on MyD88 and SIGIRR.Scand J Immunol. 2010 Jun;71(6):393-402. doi: 10.1111/j.1365-3083.2010.02392.x. Scand J Immunol. 2010. PMID: 20500691 Free PMC article.
-
Microbial TLR Agonists and Humoral Immunopathogenesis in HIV Disease.Epidemiology (Sunnyvale). 2013 Feb 2;3:120. doi: 10.4172/2161-1165.1000120. Epidemiology (Sunnyvale). 2013. PMID: 24795844 Free PMC article.
References
-
- Goodnow, C.C. 2007. Multistep pathogenesis of autoimmune disease. Cell. 130:25–35. - PubMed
-
- Bennett, C.L., J. Christie, F. Ramsdell, M.E. Brunkow, P.J. Ferguson, L. Whitesell, T.E. Kelly, F.T. Saulsbury, P.F. Chance, and H.D. Ochs. 2001. The immune dysregulation, polyendocrinopathy, enteropathy, X-linked syndrome (IPEX) is caused by mutations of FOXP3. Nat. Genet. 27:20–21. - PubMed
-
- Brunkow, M.E., E.W. Jeffery, K.A. Hjerrild, B. Paeper, L.B. Clark, S.A. Yasayko, J.E. Wilkinson, D. Galas, S.F. Ziegler, and F. Ramsdell. 2001. Disruption of a new forkhead/winged-helix protein, scurfin, results in the fatal lymphoproliferative disorder of the scurfy mouse. Nat. Genet. 27:68–73. - PubMed
-
- D'Cruz, D.P., M.A. Khamashta, and G.R. Hughes. 2007. Systemic lupus erythematosus. Lancet. 369:587–596. - PubMed
-
- Rahman, A., and D.A. Isenberg. 2008. Systemic lupus erythematosus. N. Engl. J. Med. 358:929–939. - PubMed
Publication types
MeSH terms
Substances
LinkOut - more resources
Full Text Sources
Other Literature Sources
Medical
Molecular Biology Databases
Research Materials
