. 2008 Sep 19;283(38):26016-25.
doi: 10.1074/jbc.M710349200. Epub 2008 Jul 21.

Identification of dopamine D1-D3 receptor heteromers. Indications for a role of synergistic D1-D3 receptor interactions in the striatum

Affiliations

Identification of dopamine D1-D3 receptor heteromers. Indications for a role of synergistic D1-D3 receptor interactions in the striatum

Daniel Marcellino et al. J Biol Chem. .

Abstract

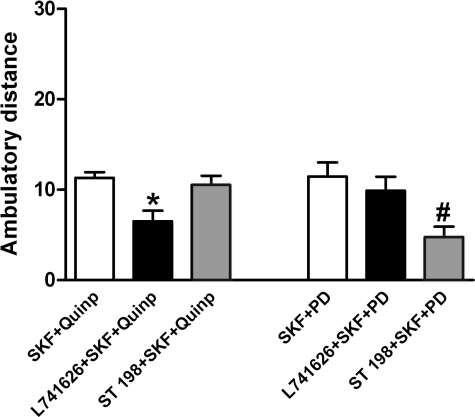
The function of dopamine D(3) receptors present in the striatum has remained elusive. In the present study evidence is provided for the existence of dopamine D(1)-D(3) receptor heteromers and for an intramembrane D(1)-D(3) receptor cross-talk in living cells and in the striatum. The formation of D(1)-D(3) receptor heteromers was demonstrated by fluorescence resonance energy transfer and bioluminescence resonance energy transfer techniques in transfected mammalian cells. In membrane preparations from these cells, a synergistic D(1)-D(3) intramembrane receptor-receptor interaction was observed, by which D(3) receptor stimulation enhances D(1) receptor agonist affinity, indicating that the D(1)-D(3) intramembrane receptor-receptor interaction is a biochemical characteristic of the D(1)-D(3) receptor heteromer. The same biochemical characteristic was also observed in membrane preparations from brain striatum, demonstrating the striatal co-localization and heteromerization of D(1) and D(3) receptors. According to the synergistic D(1)-D(3) intramembrane receptor-receptor interaction, experiments in reserpinized mice showed that D(3) receptor stimulation potentiates D(1) receptor-mediated behavioral effects by a different mechanism than D(2) receptor stimulation. The present study shows that a main functional significance of the D(3) receptor is to obtain a stronger dopaminergic response in the striatal neurons that co-express the two receptors.


Figures

FIGURE 1.
FIGURE 1.
Colocalization of D1 and D3 receptors on the plasma membrane of transiently transfected HEK-293 cells. HEK-293 cells transiently transfected with D3-GFP2 and D1-YFP were fixed and analyzed by confocal laser microscopy. A, D3 receptor immunoreactivity, in green. B, D1 receptor immunoreactivity in red. C, co-localization of both proteins is shown in yellow at the plasma membrane. D, overlapping ofgreen and redpixels is shown in white. Images are representative of four coverslips from two independent transfections.
FIGURE 2.
FIGURE 2.
Imaging FRET efficiency of the D3R-GFP2 and D1R-YFP pair by acceptor photobleaching. HEK-293T cells were transiently transfected with the plasmid DNA for the D3R-GFP2 and D1R-YFP constructs using a ratio of donor to acceptor DNA of 1:2 and fixed 48 h after transfection. Left panels are images of the D3-GFP2 donor before (Donor pre-bleach) and after (Donor post-bleach) photobleaching of the D1R-YFP acceptor obtained by spectral imaging and subsequent liner un-mixing (see “Experimental Procedures”) in several regions (ROI 1 to 5) of the lowest plane of the cell. The extent of the photobleaching is shown in the central panels as a lack of acceptor fluorescence in the selected region after photobleaching (Acceptor post-bleach) with respect to the image of the acceptor before photobleaching (Acceptor pre-bleach). The right panel represents donor un-quenching following acceptor photobleaching as donor post-bleach minus donor pre-bleach (subtraction) and a color representation of the FRET efficiency normalized to a scale from 0 to 1. The FRET efficiencies from different ROIs within the cell are given in the table below the images. As negative controls ROI 7 (out of the cell) and ROI 6 (cell section without photobleaching) were also analyzed. Images are representative of four coverslips from two independent transfections.
FIGURE 3.
FIGURE 3.
FRET efficiency of the D3-GFP2 and D1-YFP pair by sensitized emission in living cells. HEK-293T cells were transiently transfected with the plasmid DNA corresponding to D3-GFP2 (donor) and D1-YFP (acceptor) proteins using a ratio of donor to acceptor DNA of 1:2 (same transfect), or with the positive control plasmid GFP2-YFP. Fluorescence readings were performed 48 h after transfection, and linear un-mixing of the emission signals was applied to the data (see “Experimental Procedures”). Results are shown as the sensitized emission of the acceptor when the cells were excited at 400 nm. Cells separately transfected with either the D3-GFP2 (donor) or D1-YFP (acceptor) proteins and subsequently mixed before FRET measurements (sep.transfect) were used as a negative control. Data are the mean ± S.D. of five independent experiments performed in duplicate. One-way ANOVA followed by Newman-Keuls test shows significant differences between GFP2-YFP and D3-GFP2 + D1-YFP (same transfect) and between D3-GFP2 + D1-YFP (same transfect) and D3-GFP2 + D1-YFP (sep. tranfect) (p < 0.001 in all cases).
FIGURE 4.
FIGURE 4.
BRET experiments in HEK-293 cells. BRET was measured in HEK-293T cells co-expressing D3-Rluc and D1-YFP (closed squares) or D3-Rluc and CXCR4-YFP (open squares) constructs. Co-transfections were performed with increasing amounts of plasmid DNA for the YFP construct (1 μg of DNA to 10 μg of DNA), whereas the DNA for the Rluc construct was maintained constant (3 μg). Both fluorescence and luminescence of each sample were measured prior to every experiment to confirm equal expression of Rluc while monitoring the increase of YFP expression. The relative amounts of BRET acceptor are expressed as the ratio between the fluorescence of the acceptor and the luciferase activity of the donor. “YFP0” corresponds to the fluorescence value in cells expressing the BRET donor alone. BRET data are expressed as means ± S.D. of three to nine different experiments grouped as a function of the amount of BRET acceptor.
FIGURE 5.
FIGURE 5.
D1–D3 intramembrane receptor cross-talk in transfected cells. A, D3 receptor agonist-mediated modulation of D1 receptor agonist binding. Competition experiments of the D1 receptor antagonist [3H]SCH 23390 (2.5 nm) versus increasing concentrations of the D1 receptor agonist SKF 81297 in transfected cells were performed in the presence (○) or in the absence (▪) of the D3 receptor agonist R(+)-7-OH-DPAT (10 nm). B, D1 receptor agonist-mediated modulation of D3 receptor agonist binding. Competition experiments of the D2–3 receptor antagonist [3H]raclopride (5 nm) versus increasing concentrations of R(+)-7-OH-DPAT in transfected cells were performed in the presence (○) or in the absence (▪) of the D1 receptor agonist SKF 81297 (100 nm). Values are expressed as percentage of specific binding of the sample without competing ligand (control). Data are means ± S.D. from a representative experiment performed in triplicate.
FIGURE 6.
FIGURE 6.
D1–D3 intramembrane receptor cross-talk in the striatum. A, D3 receptor agonist-mediated modulation of D1 receptor agonist binding. Competition experiments of the D1 receptor antagonist [3H]SCH 23390 (2.5 nm) versus increasing concentrations of the D1 receptor agonist SKF 38393 in calf striatal membranes were performed in the presence (○) or in the absence (▪) of the D3 receptor agonist R(+)-7-OH-DPAT (10 nm). B, D1 receptor agonist-mediated modulation of D3 receptor agonist binding. Competition experiments of the D3 receptor agonist [3H]R(+)-7-OH-DPAT (1.7 nm) versus increasing concentrations of R(+)-7-OH-DPAT in calf striatal membranes were performed in the presence (○) or in the absence (▪) of the D1 receptor agonist SKF 38393 (100 nm). Values are expressed as percentage of specific binding of the sample without competing ligand (control). Data are means ± S.D. from a representative experiment performed in triplicate.
FIGURE 7.
FIGURE 7.
D1–D3 behavioral receptor interactions in reserpinized Swiss Webster mice. Effects of the D3 receptor agonist PD 128907 (PD, 0.3–3 mg/kg, i.p.) on the locomotor activation induced by the D1 receptor agonist SKF 38393 (SKF, 15 mg/kg, i.p.) and/or the D2–3 receptor agonist quinpirole (Quinp, 0.5 mg/kg, i.p.) in reserpinized mice. Results represent means ± S.E. of the average of the values obtained during 10-min periods of the first hour of recording. * and **, significantly different compared with SKF (ANOVA: p < 0.05 and p < 0.01, respectively); ##, significantly different compared with SKF+Quinp without PD co-administration (ANOVA: p < 0.01).
FIGURE 8.
FIGURE 8.
D1–D3 behavioral receptor interactions in reserpinized Swiss Webster mice. Differential effects of the D2 receptor antagonist L741626PD (3 mg/kg, i.p.) and the D3 receptor antagonist ST198 (10 mg/kg, per os) on the locomotor activation induced by the co-administration of the D1 receptor agonist SKF 38393 (SKF, 15 mg/kg, i.p.) plus the D2–3 receptor agonist quinpirole (Quinp, 0.5 mg/kg, i.p.) and the co-administration of SKF plus the D3 receptor agonist PD 128907 (PD, 3 mg/kg. i.p.) in reserpinized mice. Results represent means ± S.E. of the average of the values obtained during 10-min periods of the first hour of recording. *, significantly different compared with SKF+Quinp (ANOVA: p < 0.05); #, significantly different compared with SKF+PD (ANOVA: p < 0.05).
FIGURE 9.
FIGURE 9.
D1–D3 behavioral receptor interactions in D3KO reserpinized mice and their WT littermates. Effects of the D3 receptor agonist PD 128907 (PD, 3 mg/kg, i.p.) on the locomotor activation induced by the D1 receptor agonist SKF 38393 (SKF, 15 mg/kg, i.p.) in reserpinized D3KO and WT mice. Results represent means ± S.E. of the average of the values obtained during 10-min periods of the first hour of recording. **, significantly different compared with respective saline (ANOVA: p < 0.01, respectively); #, significantly different compared with SKF alone, without PD co-administration (ANOVA: p < 0.05).

Similar articles

Cited by

References

    1. Missale, C., Nash, S. R., Robinson, S. W., Jaber, M., and Caron, M. G. (1998) Physiol. Rev. 78 189-225 - PubMed
    1. Neve, K. A., Seamans, J. K., and Trantham-Davidson, H. (2004) J. Recept. Signal Transduct. Res. 24 165-205 - PubMed
    1. Gerfen, C. R. (2004) The Rat Nervous System (Paxinos, G., ed) pp. 445-508, Elsevier Academic Press, Amsterdam
    1. Gerfen, C. R., Engber, T. M., Mahan, L. C., Susel, Z., Chase, T. N., Monsma, F. J., Jr., and Sibley, D. R. (1990) Science 250 1429-1432 - PubMed
    1. Le Moine, C., Normand, E., and Bloch, B. (1991) Proc. Natl. Acad. Sci. U. S. A. 88 4205-4209 - PMC - PubMed

Publication types