Review
. 2008 Aug;60(8):1049-60.
doi: 10.1211/jpp.60.8.0011.

Assessment of tissue redox status using metabolic responsive contrast agents and magnetic resonance imaging

Affiliations
Review

Assessment of tissue redox status using metabolic responsive contrast agents and magnetic resonance imaging

Fuminori Hyodo et al. J Pharm Pharmacol. 2008 Aug.

Abstract

Regulation of tissue redox status is important to maintain normal physiological conditions in the living body. Disruption of redox homoeostasis may lead to oxidative stress and can induce many pathological conditions such as cancer, neurological disorders and ageing. Therefore, imaging of tissue redox status could have clinical applications. Redox imaging employing magnetic resonance imaging (MRI) with nitroxides as cell-permeable redox-sensitive contrast agents has been used for non-invasive monitoring of tissue redox status in animal models. The redox imaging applications of nitroxide electron paramagnetic resonance imaging (EPRI) and MRI are reviewed here, with a focus on application of tumour redox status monitoring. While particular emphasis has been placed on differences in the redox status in tumours compared to selected normal tissues, the technique possesses the potential to have broad applications to the study of other disease states, inflammatory processes and other circumstances where oxidative stress is implicated.


Figures
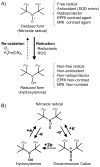
Figure 1
Figure 1
A) Reversible one-electron reduction/oxidation showing the inter-conversion between the oxidized nitroxide (EPRI and MRI Contrast) and the corresponding reduced hydroxylamine (EPRI and MRI Non-contrast). B) Conversion of nitroxide radical to hydroxylamine or oxoammonium cation in vivo. Nitroxide compounds are found in vivo in an equilibrium between the nitroxide radical form which is detected by EPR, and the reduced form, known as the hydroxylamine, which is not detected. This equilibrium is dependent on the oxygen status and redox-status of the tissue milieu. Cellular redox processes convert the compound between the two states, thus the ratio of the two states is determined by the redox activity within the cell.
Figure 2
Figure 2
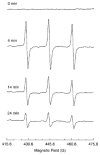
EPR spectra of 3-CP nitroxide in a RIF-1 tumor. A tumor-bearing mouse under anesthesia was infused (i.v.) with a saline solution of 3-CP (185 mg/kg). The uptake and removal of the nitroxide in the tumor tissue was continuously measured in vivo using L-band (1.3 GHz) EPR spectrometer. The triplet signal attributable to 3-CP peaked at ~ 4 min and decayed gradually with a half-life of ~10 min. The triplet, arising because of hyperfine splitting from the 14N nucleus, is characterized with coupling constants 15.78 G and 16.30 G and peak-to-peak width 1.50 G. Measurement parameters: microwave power 8 mW; modulation amplitude, 1.0 G; modulation frequency, 100 kHz; scan time, 15 s. (Adapted with permission from reference Kuppusamy et al 2002)
Figure 3
Figure 3
Pharmacokinetics of nitroxide in normal muscle and tumor tissues. Time course of the EPR signal intensity of 3-CP in the normal leg muscle and tumor tissue of RIF-1 tumor-bearing mice, infused (i.v.) with a saline solution of 3-CP, were obtained by double integration of the spectra. A) The semilog plot shows the clearance of the nitroxide (in arbitrary units) as a function of time in the normal muscle and tumor tissue of untreated tumor-bearing mice and in the tumor tissue of mice treated (i.p.) with BSO (2.25 mmol/kg) 6 h before the measurements. The solid lines through the data points are linear fit to the respective data set, which suggests compliance with a pseudo first-order rate law. B) Bar-graph showing the measured pseudo first-order rate constants of nitroxide reduction in the tissues. The data represent mean ± SE of measurements on three to five mice per group. The rate constants were: untreated normal muscle, 0.037 ± 0.005 min−1; untreated tumor, 0.063 ± 0.008 min−1, and BSO-treated tumor, 0.052 ± 0.006 min−1. *, significantly different from normal muscle; **, significantly different from untreated RIF-1 tissue. C) Spatially resolved clearance of nitroxide in RIF-1 tumor tissue. After tail vein infusion of 3-CP, a series of two-dimensional images of the nitroxide from tumor (untreated and BSO-treated) were measured using L-band EPRI method. A few selected images and the corresponding approximate time after infusion are shown. The images represent the mean nitroxide concentration in a two-dimensional projection of the tissue volume (10 × 10 mm2; depth, 5 mm) averaged over 1.5–2.0 min. The image data were acquired using a magnetic field gradient of 15 G/cm at 16 orientations in the two-dimensional plane. Each image within a series was normalized with respect to the maximum intensity in that series. The nitroxide in the tumor of BSO-treated mouse persisted longer, compared with that in the untreated mouse. (Adapted with permission from reference Kuppusamy et al 2002)
Figure 4
Figure 4
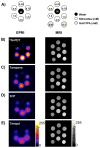
The phantom images of four nitroxides obtained by EPRI and MRI. A) Schematics of the phantom. Additionally two tubes of 0.01 and 0.1 mM Gd-DTPA solution were added during MRI measurement. The EPRI (Left column) and MR (right column) intensity images of B) 15N-PDT, C) Tempone, D) 3CP, E) Tempol were described. EPRI conditions were follows; 18 projections were obtained every 1 min. FOV was 3.2 × 3.2 cm. Microwave frequency was 300 MHz, microwave power 2.5 mW, field modulation frequency was 13.5 kHz, time constant 0.01 s, gradient was 4.7 G/cm, sweep width was 50 Gauss. MRI: SPGE sequence (TR = 75 ms, TE = 3 ms, Flip angle = 45°, NEX = 2) was employed to observe T1 effect. Pixel resolution was 256 × 256. FOV was 3.2 × 3.2 cm. All measurements were performed at room temperature (25 ± 2 °C). (Adapted with permission from reference Hyodo et al 2008)
Figure 5
Figure 5
Comparison of image intensity decay among three modalities. A) Schematic of the phantoms: Tube 1, PBS; Tube 2, 2 mM 3CP and 5 mM AsA; Tube 3, 2 mM 3CP and 10 mM AsA; Tube 4, 2 mM 3CP. Time course images and decay slops of B) EPRI, C) MRI, D) Overhauser MRI (OMRI) were obtained. After addition of AsA/PBS solution, the EPRI or OMRI measurements were started immediately and continuously measured up to 20 min. In the case of MRI, AsA/PBS was added using PE-10 tube 2 min after scanning was started. Therefore, time zero in the MRI experiment represents the time at addition of AsA solution. The experiments were repeated three or four times using with freshly prepared solutions. Semi-logarithmic plots of the time course of MRI signal change in the region of interest (ROI: 10 ×10 pixels) were used for decay rate calculation using imageJ software. Decay rate constants were obtained from the slope of linear portion of the decay curves. (Adapted with permission from reference Hyodo et al 2008)
Figure 6
Figure 6
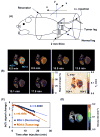
(A) Experimental arrangement of the mouse in the MRI resonator and the slice selected to monitor the nitroxide levels used to examine the differences in nitroxide metabolism in tumor and normal tissue. (B) Sequence of T1-weighted MR images as a function of time after intravenous administration of 3CP. Signal intensity in normal (ROI-1) and tumor leg (ROI-2) increased after 3CP administration and reached a maximum at 8.5 min. The nitroxide signal decreased thereafter faster in tumor region (ROI-1) than in normal tissue (ROI-2). (C) The rate of intensity change in each pixel was computed for each ROI and plotted as a function of time. The rate of intensity change in the normal leg was observed to be ~60% compared to that in tumor. (D) Parametric image redisplayed shows that tumor reduction globally is elevated compared to the normal tissue. (Adapted with permission from reference (Matsumoto et al 2006))
Figure 7
Figure 7
The pharmacokinetics of oxidized form and total (oxidized and reduced form) nitroxide contrast agents in normal leg muscle, tumor, and blood. The pharmacokinetics of oxidized form of (A) Tempol, (B) 3CP, (C) 3CxP in normal tissue (blue), tumor tissue (purple), and artery (red) were obtained by SPGR MRI. The total nitroxide contrast agent concentration of (A) Tempol, (B) 3CP, (C) 3CxP in normal tissue (upper figure, gray), tumor tissue (upper figure, black) and blood (lower figure. black) were measured ex vivo by x-band EPR spectroscopy using 10 mM ferricyanide/PBS solution (final concentration was 2 mM). (Adapted with permission from (Hyodo et al 2006))
Figure 8
Figure 8
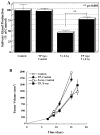
A) Salivary gland production for fractionated radiation treatment with and without Tempol administration. B) Radiation tumor (SCCVII) regrowth study for local fractionated radiation treatment with and without Tempol administration. Tumors received 5 daily fractions (Monday-Friday) of 3 Gy (SCC VII) or 2 Gy (HT-29). Arrows on each plot indicate the days when radiation treatment was administered. (Adapted with permission from (Cotrim et al 2007))
Figure 9
Figure 9
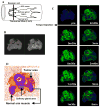
A) Schematic of the placement of the mouse in the resonator and the slice selected for MRI experiments. A transverse slice (2 mm) covering the normal muscle tissue (Greenlee et al), salivary gland, and the tumor in the contra lateral leg was chosen to monitor nitroxide levels as a function of time. B) T2-weighted images of adjacent slices before injecting Tempol to ensure that the target tissues were in the field of view. C) T1 weighted images of the selected region before injection of Tempol and as a function of time after i.v. Tempol injection. D) T2 map of the slice and the regions of interest chosen in the normal leg, salivary gland, and tumor to monitor Tempol decay rates. (Adapted with permission from (Cotrim et al 2007))
Figure 10
Figure 10
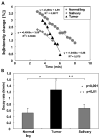
A) Representative Tempol decay rates after i.v. injection in a mouse for the selected regions of interest shown in Figure 5D. B) Summary of decay rates from the three regions of interest in normal muscle, salivary gland, and tumor. (Adapted with permission from (Cotrim et al 2007))

Similar articles

Cited by

References

    1. Barbier EL, Lamalle L, Decorps M. Methodology of brain perfusion imaging. J Magn Reson Imaging. 2001;13:496–520. - PubMed
    1. Berliner JL, Fujii H. Magnetic resonance imaging of biological specimens by electron paramagnetic resonance of nitroxide spin labels. Science. 1985;227:517–9. - PubMed
    1. Berliner LJ, Fujii H, Wan XM, Lukiewicz SJ. Feasibility study of imaging a living murine tumor by electron paramagnetic resonance. Magn Reson Med. 1987;4:380–4. - PubMed
    1. Brasch RC. Work in progress: methods of contrast enhancement for NMR imaging and potential applications. A subject review. Radiology. 1983;147:781–8. - PubMed
    1. Brasch RC, London DA, Wesbey GE, Tozer TN, Nitecki DE, Williams RD, Doemeny J, Tuck LD, Lallemand DP. Work in progress: nuclear magnetic resonance study of a paramagnetic nitroxide contrast agent for enhancement of renal structures in experimental animals. Radiology. 1983;147:773–9. - PubMed

Publication types