

Distinct roles for two histamine receptors (hclA and hclB) at the Drosophila photoreceptor synapse
- PMID: 18632929
- PMCID: PMC6670387
- DOI: 10.1523/JNEUROSCI.1654-08.2008
Distinct roles for two histamine receptors (hclA and hclB) at the Drosophila photoreceptor synapse
Abstract
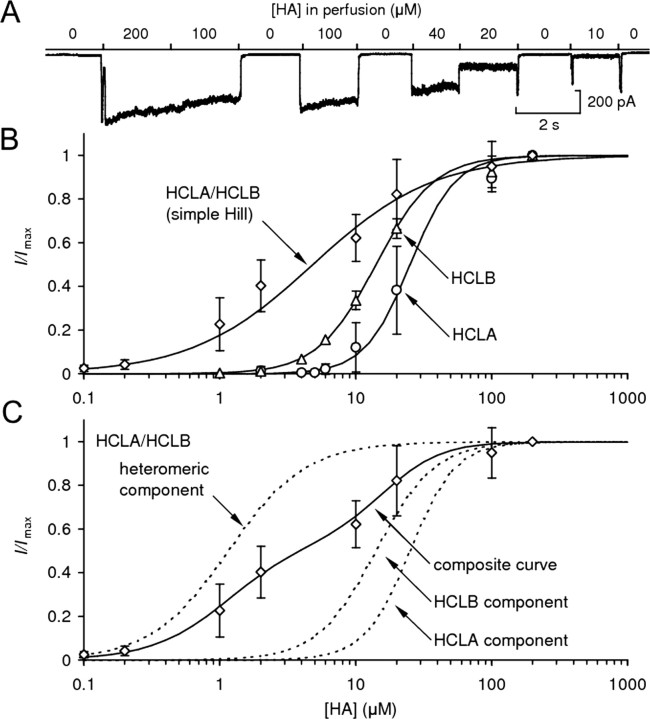
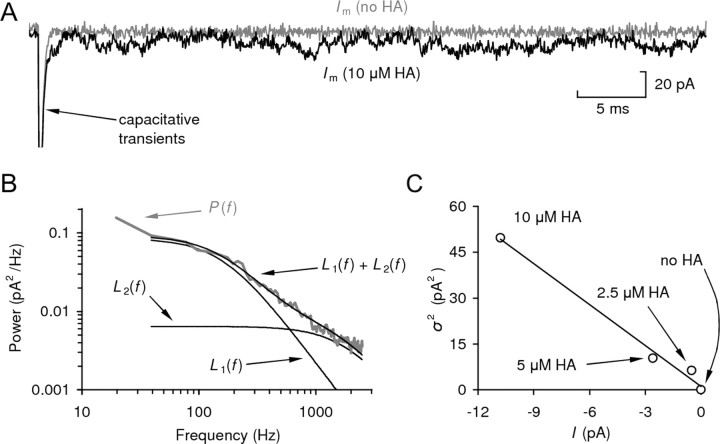
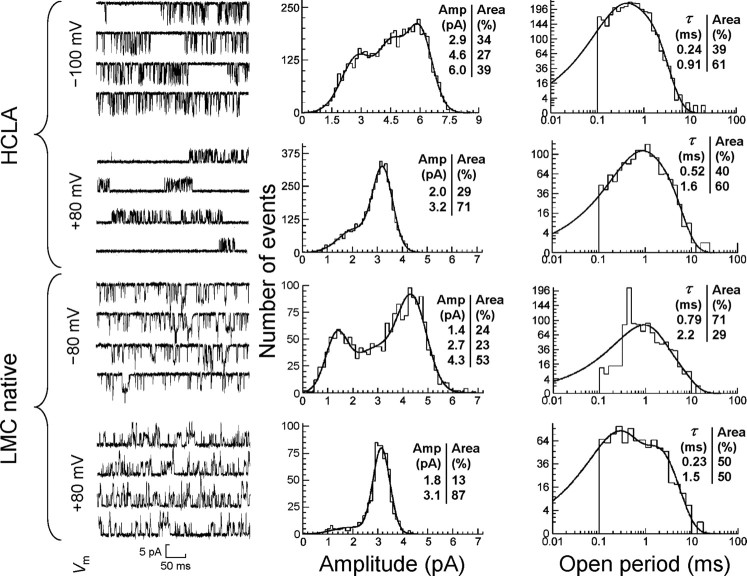
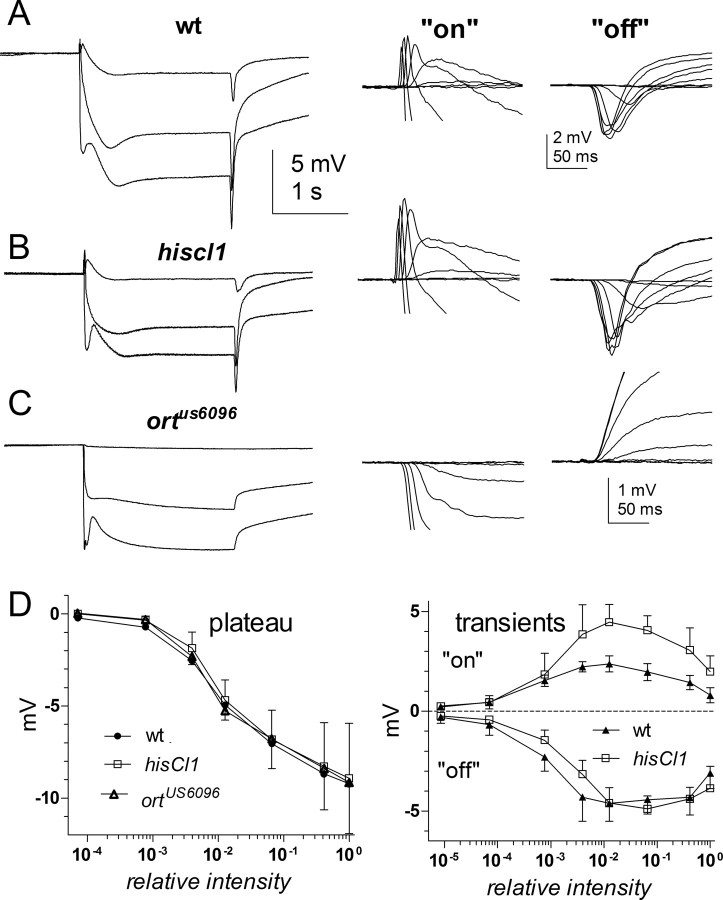
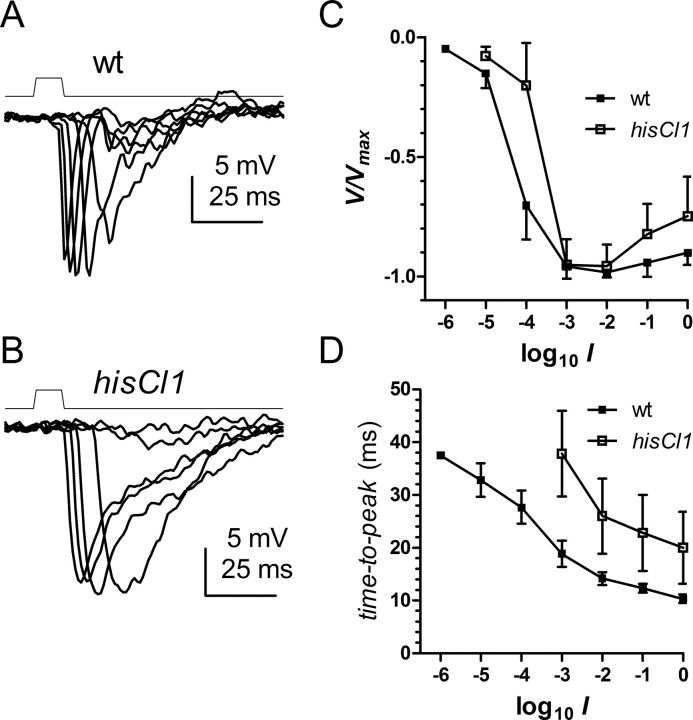
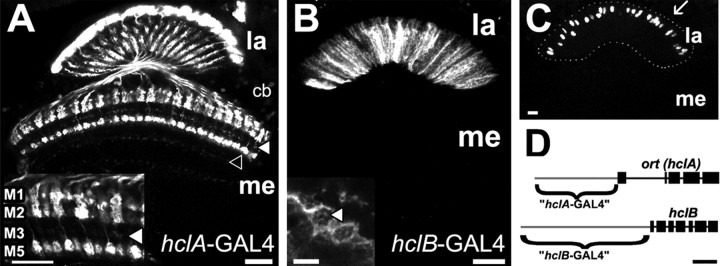
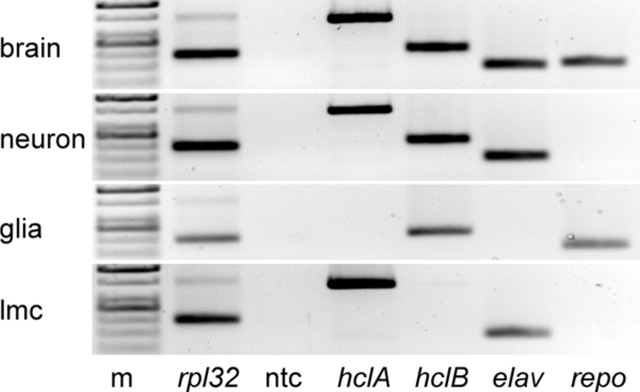
Histamine (HA) is the photoreceptor neurotransmitter in arthropods, directly gating chloride channels on large monopolar cells (LMCs), postsynaptic to photoreceptors in the lamina. Two histamine-gated channel genes that could contribute to this channel in Drosophila are hclA (also known as ort) and hclB (also known as hisCl1), both encoding novel members of the Cys-loop receptor superfamily. Drosophila S2 cells transfected with these genes expressed both homomeric and heteromeric histamine-gated chloride channels. The electrophysiological properties of these channels were compared with those from isolated Drosophila LMCs. HCLA homomers had nearly identical HA sensitivity to the native receptors (EC(50) = 25 microM). Single-channel analysis revealed further close similarity in terms of single-channel kinetics and subconductance states ( approximately 25, 40, and 60 pS, the latter strongly voltage dependent). In contrast, HCLB homomers and heteromeric receptors were more sensitive to HA (EC(50) = 14 and 1.2 microM, respectively), with much smaller single-channel conductances ( approximately 4 pS). Null mutations of hclA (ort(US6096)) abolished the synaptic transients in the electroretinograms (ERGs). Surprisingly, the ERG "on" transients in hclB mutants transients were approximately twofold enhanced, whereas intracellular recordings from their LMCs revealed altered responses with slower kinetics. However, HCLB expression within the lamina, assessed by both a GFP (green fluorescent protein) reporter gene strategy and mRNA tagging, was exclusively localized to the glia cells, whereas HCLA expression was confirmed in the LMCs. Our results suggest that the native receptor at the LMC synapse is an HCLA homomer, whereas HCLB signaling via the lamina glia plays a previously unrecognized role in shaping the LMC postsynaptic response.
Figures
Similar articles
-
Participation of the histamine receptor encoded by the gene hclB (HCLB) in visual sensitivity control: an electroretinographic study in Drosophila melanogaster.Mol Vis. 2012;18:2497-508. Epub 2012 Oct 6. Mol Vis. 2012. PMID: 23077407 Free PMC article.
-
The target of Drosophila photoreceptor synaptic transmission is a histamine-gated chloride channel encoded by ort (hclA).J Biol Chem. 2002 Nov 1;277(44):42113-20. doi: 10.1074/jbc.M207133200. Epub 2002 Aug 23. J Biol Chem. 2002. PMID: 12196539
-
Functional consequences of mutations in the Drosophila histamine receptor HCLB.J Insect Physiol. 2010 Jan;56(1):21-7. doi: 10.1016/j.jinsphys.2009.08.016. J Insect Physiol. 2010. PMID: 19716373 Free PMC article.
-
The dynamics of signaling at the histaminergic photoreceptor synapse of arthropods.Prog Neurobiol. 2007 Jul;82(4):202-27. doi: 10.1016/j.pneurobio.2007.03.006. Epub 2007 Apr 19. Prog Neurobiol. 2007. PMID: 17531368 Review.
-
Neurotransmitter regulation of circadian structural changes in the fly's visual system.Microsc Res Tech. 1999 Apr 15;45(2):96-105. doi: 10.1002/(SICI)1097-0029(19990415)45:2<96::AID-JEMT4>3.0.CO;2-L. Microsc Res Tech. 1999. PMID: 10332727 Review.
Cited by
-
Light exposure during development affects physiology of adults in Drosophila melanogaster.Front Physiol. 2022 Nov 25;13:1008154. doi: 10.3389/fphys.2022.1008154. eCollection 2022. Front Physiol. 2022. PMID: 36505068 Free PMC article.
-
Mechanisms underlying homeostatic plasticity in the Drosophila mushroom body in vivo.Proc Natl Acad Sci U S A. 2020 Jul 14;117(28):16606-16615. doi: 10.1073/pnas.1921294117. Epub 2020 Jun 29. Proc Natl Acad Sci U S A. 2020. PMID: 32601210 Free PMC article.
-
Synaptic targets of photoreceptors specialized to detect color and skylight polarization in Drosophila.Elife. 2021 Dec 16;10:e71858. doi: 10.7554/eLife.71858. Elife. 2021. PMID: 34913436 Free PMC article.
-
Visual processing in the fly, from photoreceptors to behavior.Genetics. 2023 May 26;224(2):iyad064. doi: 10.1093/genetics/iyad064. Genetics. 2023. PMID: 37128740 Free PMC article.
-
Better Sleep at Night: How Light Influences Sleep in Drosophila.Front Physiol. 2020 Sep 4;11:997. doi: 10.3389/fphys.2020.00997. eCollection 2020. Front Physiol. 2020. PMID: 33013437 Free PMC article. Review.
References
-
- Buchner E. Genes expressed in the adult brain of Drosophila and effects of their mutations on behavior: a survey of transmitter- and second messenger-related genes. J Neurogenet. 1991;7:153–192. - PubMed
-
- Buchner E, Buchner S, Burg MG, Hofbauer A, Pak WL, Pollack I. Histamine is a major mechanosensory neurotransmitter candidate in Drosophila melanogaster. Cell Tissue Res. 1993;273:119–125. - PubMed
-
- Burkhardt W, Braitenberg V. Some peculiar synaptic complexes in the first visual ganglion of the fly, Musca domestica. Cell Tissue Res. 1976;173:287–308. - PubMed
-
- Callaway JC, Stuart AE. Biochemical and physiological evidence that histamine is the transmitter of barnacle photoreceptors. Vis Neurosci. 1989;3:311–325. - PubMed
-
- Colquhoun D, Hawkes AG. Relaxation and fluctuations of membrane currents that flow through drug-operated channels. Proc R Soc Lond B Biol Sci. 1977;199:231–262. - PubMed
Publication types
MeSH terms
Substances
Grants and funding
LinkOut - more resources
Full Text Sources
Other Literature Sources
Molecular Biology Databases