

Defining a chromatin pattern that characterizes DNA-hypermethylated genes in colon cancer cells
- PMID: 18632628
- PMCID: PMC2706536
- DOI: 10.1158/0008-5472.CAN-08-0700
Defining a chromatin pattern that characterizes DNA-hypermethylated genes in colon cancer cells
Abstract
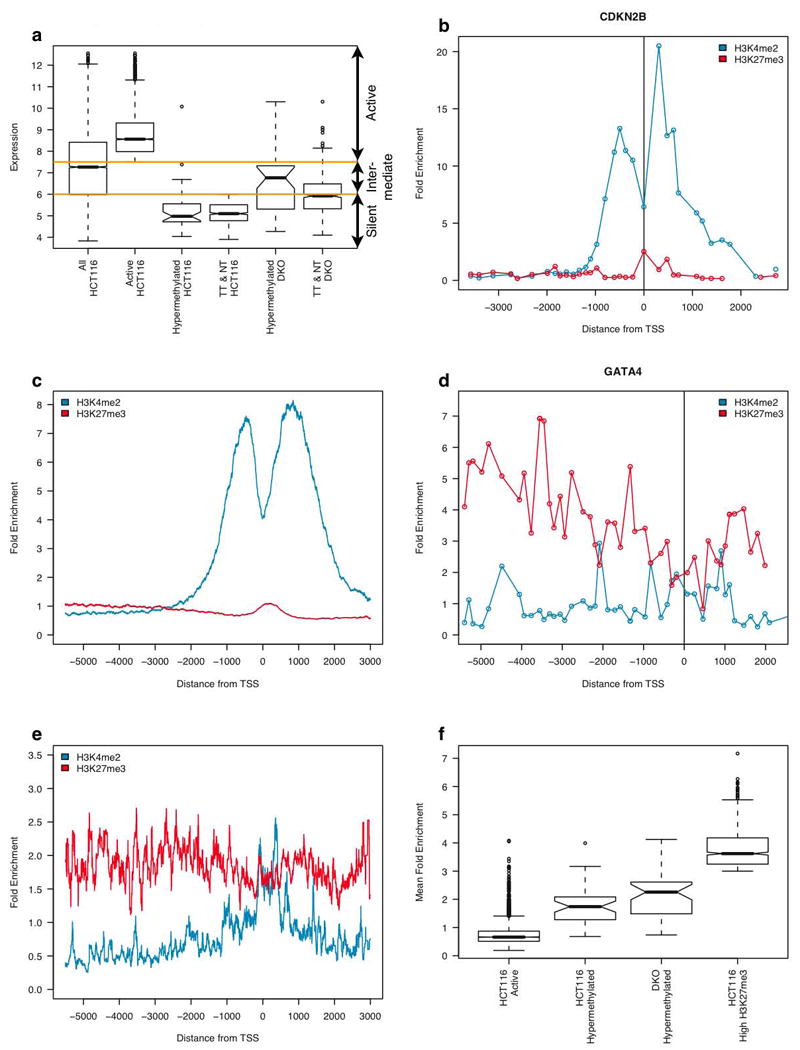
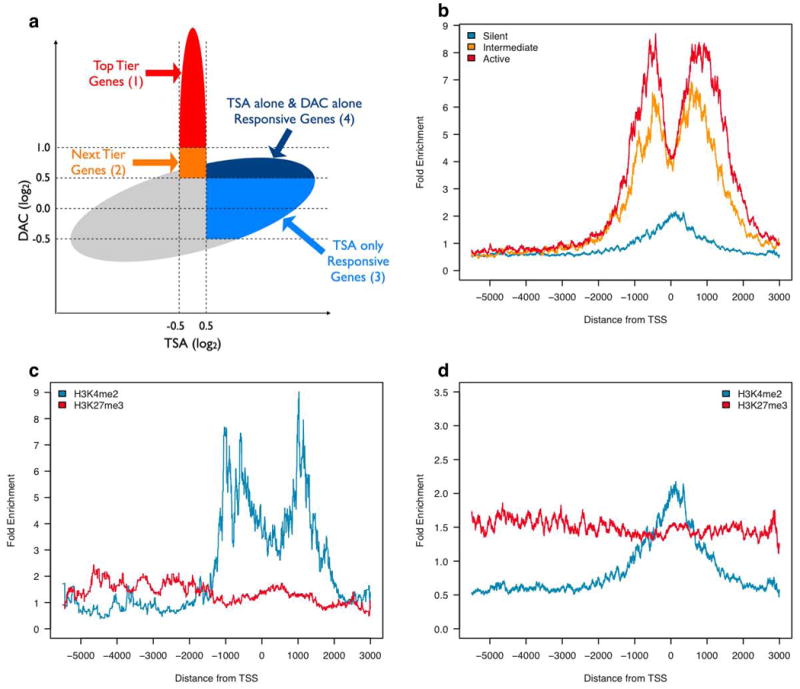
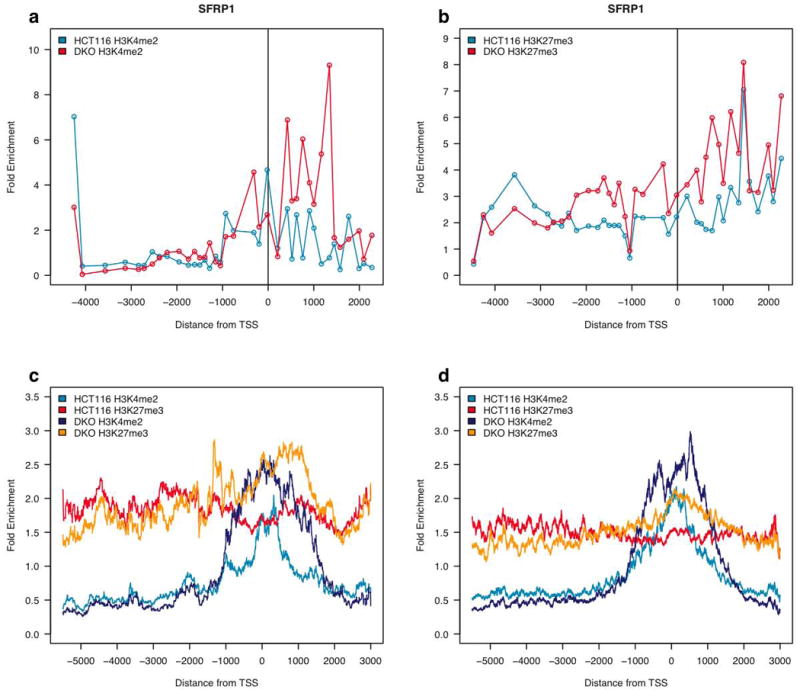
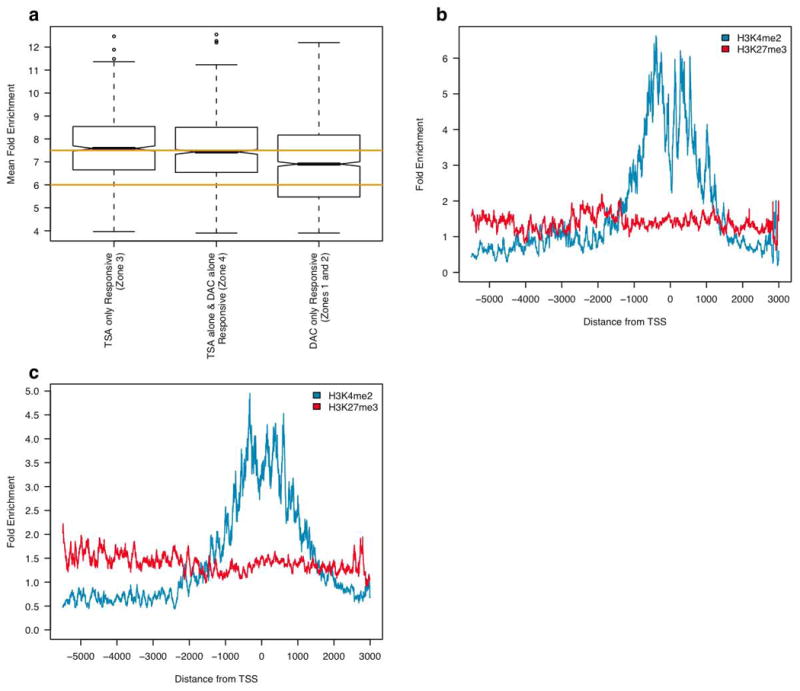
Epigenetic gene regulation is a key determinant of heritable gene expression patterns and is critical for normal cellular function. Dysregulation of epigenetic transcriptional control is a fundamental feature of cancer, particularly manifesting as increased promoter DNA methylation with associated aberrant gene silencing, which plays a significant role in tumor progression. We now globally map key chromatin parameters for genes with promoter CpG island DNA hypermethylation in colon cancer cells by combining microarray gene expression analyses with chromatin immunoprecipitation-on-chip technology. We first show that the silent state of such genes universally correlates with a broad distribution of a low but distinct level of the PcG-mediated histone modification, methylation of lysine 27 of histone 3 (H3K27me), and a very low level of the active mark H3K4me2. This chromatin pattern, and particularly H3K4me2 levels, crisply separates DNA-hypermethylated genes from those where histone deacetylation is responsible for transcriptional silencing. Moreover, the chromatin pattern can markedly enhance identification of truly silent and DNA-hypermethylated genes. We additionally find that when DNA-hypermethylated genes are demethylated and reexpressed, they adopt a bivalent chromatin pattern, which is associated with the poised gene expression state of a large group of embryonic stem cell genes and is characterized by an increase in levels of both the H3K27me3 and H3K4me2 marks. Our data have great relevance for the increasing interest in reexpression of DNA-hypermethylated genes for the treatment of cancer.
Figures
Similar articles
-
A DNA hypermethylation module for the stem/progenitor cell signature of cancer.Genome Res. 2012 May;22(5):837-49. doi: 10.1101/gr.131169.111. Epub 2012 Mar 5. Genome Res. 2012. PMID: 22391556 Free PMC article.
-
PcG proteins, DNA methylation, and gene repression by chromatin looping.PLoS Biol. 2008 Dec 2;6(12):2911-27. doi: 10.1371/journal.pbio.0060306. PLoS Biol. 2008. PMID: 19053175 Free PMC article.
-
Bivalent domains enforce transcriptional memory of DNA methylated genes in cancer cells.Proc Natl Acad Sci U S A. 2008 Dec 16;105(50):19809-14. doi: 10.1073/pnas.0810133105. Epub 2008 Dec 5. Proc Natl Acad Sci U S A. 2008. PMID: 19060200 Free PMC article.
-
Epigenetic gene silencing in cancer initiation and progression.Cancer Lett. 2003 Feb 20;190(2):125-33. doi: 10.1016/s0304-3835(02)00511-6. Cancer Lett. 2003. PMID: 12565166 Review.
-
Aberrant patterns of DNA methylation, chromatin formation and gene expression in cancer.Hum Mol Genet. 2001 Apr;10(7):687-92. doi: 10.1093/hmg/10.7.687. Hum Mol Genet. 2001. PMID: 11257100 Review.
Cited by
-
The role of DNA methylation in directing the functional organization of the cancer epigenome.Genome Res. 2015 Apr;25(4):467-77. doi: 10.1101/gr.183368.114. Epub 2015 Mar 6. Genome Res. 2015. PMID: 25747664 Free PMC article.
-
Bivalent chromatin: a developmental balancing act tipped in cancer.Biochem Soc Trans. 2024 Feb 28;52(1):217-229. doi: 10.1042/BST20230426. Biochem Soc Trans. 2024. PMID: 38385532 Free PMC article. Review.
-
Aberrant silencing of cancer-related genes by CpG hypermethylation occurs independently of their spatial organization in the nucleus.Cancer Res. 2010 Oct 15;70(20):8015-24. doi: 10.1158/0008-5472.CAN-10-0765. Epub 2010 Aug 24. Cancer Res. 2010. PMID: 20736368 Free PMC article.
-
Cancer-related epigenome changes associated with reprogramming to induced pluripotent stem cells.Cancer Res. 2010 Oct 1;70(19):7662-73. doi: 10.1158/0008-5472.CAN-10-1361. Epub 2010 Sep 14. Cancer Res. 2010. PMID: 20841480 Free PMC article.
-
Matrix metalloproteinase-10 promotes Kras-mediated bronchio-alveolar stem cell expansion and lung cancer formation.PLoS One. 2011;6(10):e26439. doi: 10.1371/journal.pone.0026439. Epub 2011 Oct 17. PLoS One. 2011. PMID: 22022614 Free PMC article.
References
-
- Egger G, Liang G, Aparicio A, Jones PA. Epigenetics in human disease and prospects for epigenetic therapy. Nature. 2004;429:457–63. - PubMed
-
- Rhee I, Bachman KE, Park BH, et al. DNMT1 and DNMT3b cooperate to silence genes in human cancer cells. Nature. 2002;416:552–6. - PubMed
-
- McGarvey KM, Fahrner JA, Greene E, Martens J, Jenuwein T, Baylin SB. Silenced tumor suppressor genes reactivated by DNA demethylation do not return to a fully euchromatic chromatin state. Cancer Res. 2006;66:3541–9. - PubMed
-
- Bernstein BE, Mikkelsen TS, Xie X, et al. A bivalent chromatin structure marks key developmental genes in embryonic stem cells. Cell. 2006;125:315–26. - PubMed
Publication types
MeSH terms
Substances
Grants and funding
LinkOut - more resources
Full Text Sources
Molecular Biology Databases
