

Genomic markers for malignant progression in pulmonary adenocarcinoma with bronchioloalveolar features
- PMID: 18632575
- PMCID: PMC2465804
- DOI: 10.1073/pnas.0709618105
Genomic markers for malignant progression in pulmonary adenocarcinoma with bronchioloalveolar features
Abstract
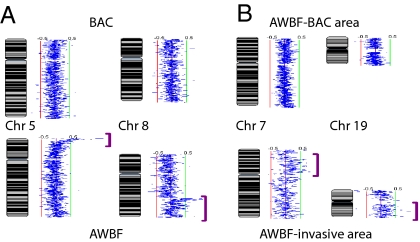
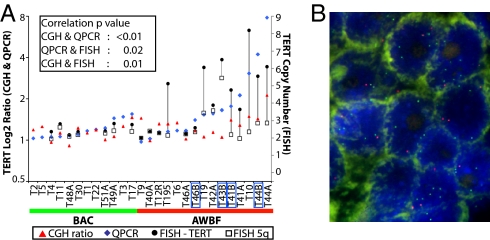
Bronchioloalveolar carcinoma (BAC), a subtype of lung adenocarcinoma (ADC) without stromal, vascular, or pleural invasion, is considered an in situ tumor with a 100% survival rate. However, the histological criteria for invasion remain controversial. BAC-like areas may accompany otherwise invasive adenocarcinoma, referred to as mixed type adenocarcinoma with BAC features (AWBF). AWBF are considered to evolve from BAC, representing a paradigm for malignant progression in ADC. However, the supporting molecular evidence remains forthcoming. Here, we have studied the genomic changes of BAC and AWBF by array comparative genomic hybridization (CGH). We used submegabase-resolution tiling set array CGH to compare the genomic profiles of 14 BAC or BAC with focal area suspicious for invasion with those of 15 AWBF. Threshold-filtering and frequency-scoring analysis found that genomic profiles of noninvasive and focally invasive BAC are indistinguishable and show fewer aberrations than tumor cells in BAC-like areas of AWBF. These aberrations occurred mainly at the subtelomeric chromosomal regions. Increased genomic alterations were noted between BAC-like and invasive areas of AWBF. We identified 113 genes that best differentiated BAC from AWBF and were considered candidate marker genes for tumor invasion and progression. Correlative gene expression analyses demonstrated a high percentage of them to be poor prognosis markers in early stage ADC. Quantitative PCR also validated the amplification and overexpression of PDCD6 and TERT on chromosome 5p and the prognostic significance of PDCD6 in early stage ADC patients. We identified candidate genes that may be responsible for and are potential markers for malignant progression in AWBF.
Conflict of interest statement
The authors declare no conflict of interest.
Figures


Similar articles
-
Frequency of EGFR and KRAS mutations in Japanese patients with lung adenocarcinoma with features of the mucinous subtype of bronchioloalveolar carcinoma.J Thorac Oncol. 2010 Aug;5(8):1197-200. doi: 10.1097/JTO.0b013e3181e2a2bc. J Thorac Oncol. 2010. PMID: 20661086 Clinical Trial.
-
Epidermal growth factor receptor mutation and p53 overexpression during the multistage progression of small adenocarcinoma of the lung.J Thorac Oncol. 2010 Jul;5(7):964-9. doi: 10.1097/JTO.0b013e3181dd15c0. J Thorac Oncol. 2010. PMID: 20512074
-
[Clinicopathologic study of pulmonary adenocarcinoma with features of bronchioloalveolar carcinoma].Zhonghua Bing Li Xue Za Zhi. 2008 Nov;37(11):737-42. Zhonghua Bing Li Xue Za Zhi. 2008. PMID: 19094707 Chinese.
-
SCCRO expression correlates with invasive progression in bronchioloalveolar carcinoma.Ann Thorac Surg. 2004 Nov;78(5):1734-41. doi: 10.1016/j.athoracsur.2004.05.056. Ann Thorac Surg. 2004. PMID: 15511464 Review.
-
Minimally invasive adenocarcinomas of the lung.Adv Anat Pathol. 2009 May;16(3):166-71. doi: 10.1097/PAP.0b013e3181a19e3b. Adv Anat Pathol. 2009. PMID: 19395880 Review.
Cited by
-
Nuclear ALG-2 protein interacts with Ca2+ homeostasis endoplasmic reticulum protein (CHERP) Ca2+-dependently and participates in regulation of alternative splicing of inositol trisphosphate receptor type 1 (IP3R1) pre-mRNA.J Biol Chem. 2013 Nov 15;288(46):33361-75. doi: 10.1074/jbc.M113.497479. Epub 2013 Sep 27. J Biol Chem. 2013. PMID: 24078636 Free PMC article.
-
Programmed cell death 6 (PDCD6) as a prognostic marker for gastric cancers.Tumour Biol. 2012 Apr;33(2):485-94. doi: 10.1007/s13277-011-0280-4. Epub 2011 Dec 13. Tumour Biol. 2012. PMID: 22161137
-
ALG-2 participates in recovery of cells after plasma membrane damage by electroporation and digitonin treatment.PLoS One. 2018 Sep 21;13(9):e0204520. doi: 10.1371/journal.pone.0204520. eCollection 2018. PLoS One. 2018. PMID: 30240438 Free PMC article.
-
Expression of Transforming Growth Factor β1 and E-Cadherin Proteins in Pulmonary Adenocarcinoma: Its Significance in Tumor Progression.Cancer Res Treat. 2013 Jun;45(2):118-25. doi: 10.4143/crt.2013.45.2.118. Epub 2013 Jun 30. Cancer Res Treat. 2013. PMID: 23864845 Free PMC article.
-
The TERT rs2736100 polymorphism and cancer risk: a meta-analysis based on 25 case-control studies.BMC Cancer. 2012 Jan 5;12:7. doi: 10.1186/1471-2407-12-7. BMC Cancer. 2012. PMID: 22221621 Free PMC article. Review.
References
-
- Travis WD, Travis LB, Devesa SS. Lung Cancer. Cancer. 1995;75:191–202. - PubMed
-
- Travis WD, Brambilla E, Müller-Hermelink HK, Harris CC, editors. WHO Classification of Tumors: Pathology and Genetics of Tumors of the Lung, Pleura, Thymus and Heart. Lyon: IARC Press; 2004. pp. 35–44.
-
- Kitamura H, Kameda Y, Ito T, Hayashi H. Atypical adenomatous hyperplasia of the lung. Implications for the pathogenesis of peripheral lung adenocarcinoma. Am J Clin Pathol. 1999;111:610–622. - PubMed
-
- Kim CF, et al. Identification of bronchioalveolar stem cells in normal lung and lung cancer. Cell. 2005;121:823–835. - PubMed
Publication types
MeSH terms
Substances
Associated data
- Actions
LinkOut - more resources
Full Text Sources
Other Literature Sources
Medical
Molecular Biology Databases
