

Hit selection with false discovery rate control in genome-scale RNAi screens
- PMID: 18628291
- PMCID: PMC2504311
- DOI: 10.1093/nar/gkn435
Hit selection with false discovery rate control in genome-scale RNAi screens
Abstract
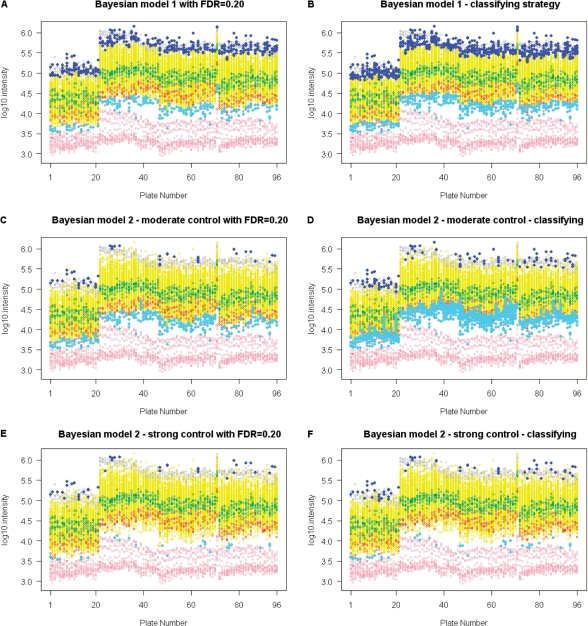
RNA interference (RNAi) is a modality in which small double-stranded RNA molecules (siRNAs) designed to lead to the degradation of specific mRNAs are introduced into cells or organisms. siRNA libraries have been developed in which siRNAs targeting virtually every gene in the human genome are designed, synthesized and are presented for introduction into cells by transfection in a microtiter plate array. These siRNAs can then be transfected into cells using high-throughput screening (HTS) methodologies. The goal of RNAi HTS is to identify a set of siRNAs that inhibit or activate defined cellular phenotypes. The commonly used analysis methods including median +/- kMAD have issues about error rates in multiple hypothesis testing and plate-wise versus experiment-wise analysis. We propose a methodology based on a Bayesian framework to address these issues. Our approach allows for sharing of information across plates in a plate-wise analysis, which obviates the need for choosing either a plate-wise or experimental-wise analysis. The proposed approach incorporates information from reliable controls to achieve a higher power and a balance between the contribution from the samples and control wells. Our approach provides false discovery rate (FDR) control to address multiple testing issues and it is robust to outliers.
Figures

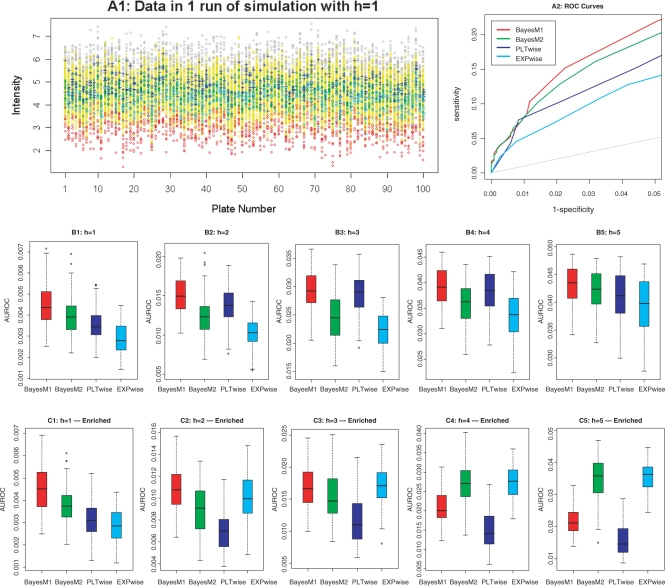
 . In this panel, green, red, gray and yellow points represent a negative control, inhibition control, activation control and nonhits, respectively; blue and light blue crosses represent activation and inhibition hits, respectively. A2 shows the ROC curves by applying four methods to the data in A1. B1−B5 (and C1−C5) show AUROC's for the specificity between 1 and 0.95 in the first (and second) simulation study with h = 1, 2, 3, 4 and 5, respectively. In each A1, B1–B5 and C1–C5, the Bayesian models 1–2, plate-wise and experiment-wise median ± kMAD are labeled as BayesM1 (red), BayesM2 (green), PLT wise (blue) and EXP wise (light blue), respectively.
Similar articles
-
Median absolute deviation to improve hit selection for genome-scale RNAi screens.J Biomol Screen. 2008 Feb;13(2):149-58. doi: 10.1177/1087057107312035. Epub 2008 Jan 23. J Biomol Screen. 2008. PMID: 18216396
-
The use of SSMD-based false discovery and false nondiscovery rates in genome-scale RNAi screens.J Biomol Screen. 2010 Oct;15(9):1123-31. doi: 10.1177/1087057110381919. Epub 2010 Sep 17. J Biomol Screen. 2010. PMID: 20852024
-
An effective method for controlling false discovery and false nondiscovery rates in genome-scale RNAi screens.J Biomol Screen. 2010 Oct;15(9):1116-22. doi: 10.1177/1087057110381783. Epub 2010 Sep 20. J Biomol Screen. 2010. PMID: 20855561
-
Functional genomic analysis of cell division by endoribonuclease-prepared siRNAs.Cell Cycle. 2005 Apr;4(4):564-7. Epub 2005 Apr 19. Cell Cycle. 2005. PMID: 15876870 Review.
-
Cellular phenotyping by RNAi.Brief Funct Genomic Proteomic. 2006 Mar;5(1):52-6. doi: 10.1093/bfgp/ell007. Epub 2006 Feb 23. Brief Funct Genomic Proteomic. 2006. PMID: 16769679 Review.
Cited by
-
Automated microscopy for high-content RNAi screening.J Cell Biol. 2010 Feb 22;188(4):453-61. doi: 10.1083/jcb.200910105. J Cell Biol. 2010. PMID: 20176920 Free PMC article. Review.
-
Statistical methods for analysis of high-throughput RNA interference screens.Nat Methods. 2009 Aug;6(8):569-75. doi: 10.1038/nmeth.1351. Nat Methods. 2009. PMID: 19644458 Free PMC article. Review.
-
Comprehensive analysis of high-throughput screens with HiTSeekR.Nucleic Acids Res. 2016 Aug 19;44(14):6639-48. doi: 10.1093/nar/gkw554. Epub 2016 Jun 21. Nucleic Acids Res. 2016. PMID: 27330136 Free PMC article.
-
Cell division cycle 7 kinase is a negative regulator of cell-mediated collagen degradation.Am J Physiol Lung Cell Mol Physiol. 2018 Sep 1;315(3):L360-L370. doi: 10.1152/ajplung.00144.2018. Epub 2018 May 24. Am J Physiol Lung Cell Mol Physiol. 2018. PMID: 29792348 Free PMC article.
-
Antiviral Stratagems Against HIV-1 Using RNA Interference (RNAi) Technology.Evol Bioinform Online. 2013 May 16;9:203-13. doi: 10.4137/EBO.S11412. Print 2013. Evol Bioinform Online. 2013. PMID: 23761954 Free PMC article.
References
-
- Fire A, Xu SQ, Montgomery MK, Kostas SA, Driver SE, Mello CC. Potent and specific genetic interference by double-stranded RNA in Caenorhabditis elegans. Nature. 1998;391:806–811. - PubMed
-
- Hannon GJ, Zamore PD. Small RNAs, big biology: biochemical studies of RNA interference. In: Hannon GJ, editor. a Guide to Gene Silencing. New York: Cold Spring Harbor Laboratory Press; 2003. pp. 87–108.
-
- Eisenstein M. Quality control. Nature. 2006;442:1067–1070. - PubMed
-
- Zhang XD, Ferrer M, Espeseth AS, Marine SD, Stec EM, Crackower MA, Holder DJ, Heyse JF, Strulovici B. The use of strictly standardized mean difference for hit selection in primary RNA interference high-throughput screening experiments. J. Biomol. Screen. 2007;12:497–509. - PubMed
