

Characterization of megakaryocyte GATA1-interacting proteins: the corepressor ETO2 and GATA1 interact to regulate terminal megakaryocyte maturation
- PMID: 18625887
- PMCID: PMC2556610
- DOI: 10.1182/blood-2008-03-146605
Characterization of megakaryocyte GATA1-interacting proteins: the corepressor ETO2 and GATA1 interact to regulate terminal megakaryocyte maturation
Abstract
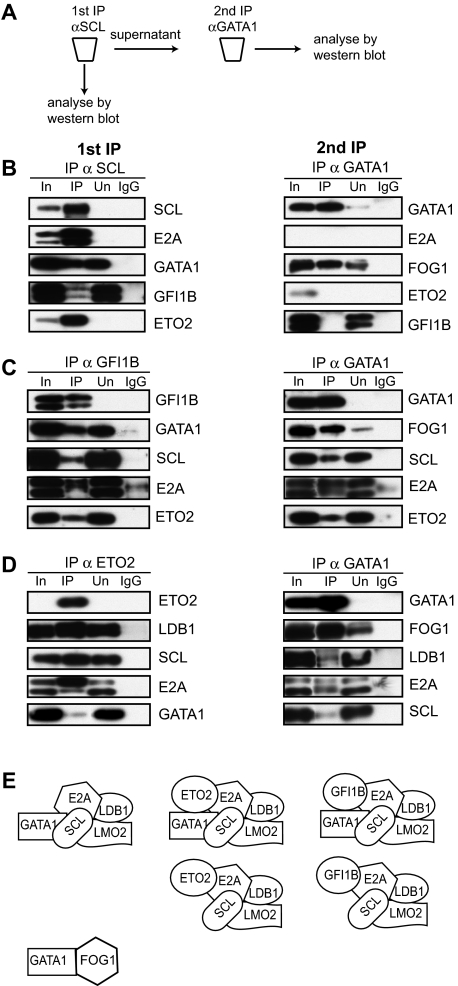
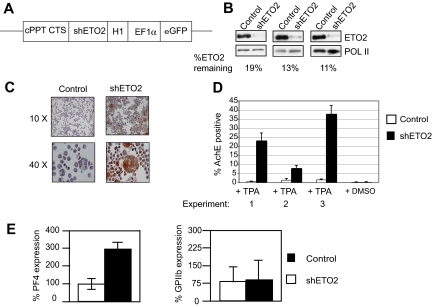
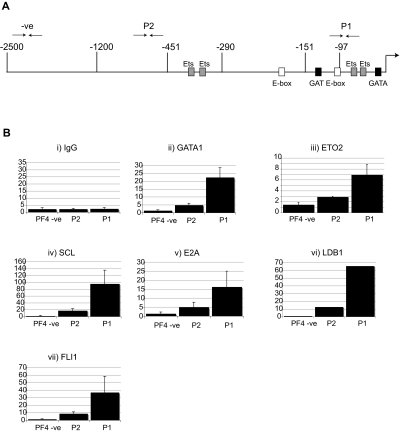
The transcription factor GATA1 coordinates timely activation and repression of megakaryocyte gene expression. Loss of GATA1 function results in excessive megakaryocyte proliferation and disordered terminal platelet maturation, leading to thrombocytopenia and leukemia in patients. The mechanisms by which GATA1 does this are unclear. We have used in vivo biotinylated GATA1 to isolate megakaryocyte GATA1-partner proteins. Here, several independent approaches show that GATA1 interacts with several proteins in the megakaryocyte cell line L8057 and in primary megakaryocytes. They include FOG1, the NURD complex, the pentameric complex containing SCL/TAL-1, the zinc-finger regulators GFI1B and ZFP143, and the corepressor ETO2. Knockdown of ETO2 expression promotes megakaryocyte differentiation and enhances expression of select genes expressed in terminal megakaryocyte maturation, eg, platelet factor 4 (Pf4). ETO2-dependent direct repression of the Pf4 proximal promoter is mediated by GATA-binding sites and an E-Box motif. Consistent with this, endogenous ETO2, GATA1, and the SCL pentameric complex all specifically bind the promoter in vivo. Finally, as ETO2 expression is restricted to immature megakaryocytes, these data suggest that ETO2 directly represses inappropriate early expression of a subset of terminally expressed megakaryocyte genes by binding to GATA1 and SCL.
Figures
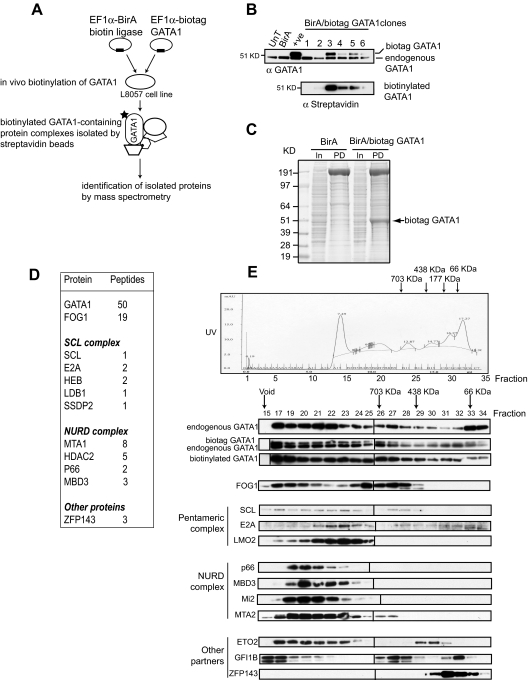
 indicates biotinylated GATA1 (biotag GATA1), as determined by mass spectrometry. (D) Table of proteins and the number of peptides precipitated by streptavidin beads and identified by mass spectrometry. (E) Gel filtration analysis (top). An example of fractionation of crude nuclear extracts from L8057 cells transfected with BirA/biotag GATA1 on a Superose 6 column. Similar results were obtained from wild-type nuclear extracts. indicates position where protein molecular markers elute. The UV profile indicates that proteins elute in a broad fractionation profile. Fractions were taken from the Superose 6 column, precipitated, and analyzed by Western blotting for GATA1 and several potential protein partners (bottom panels). The antibody used is indicated on the lefthand side of the panel. Note that endogenous GATA1 and biotag-GATA1 have a similar elution profile. Vertical line(s) have been inserted to indicate a repositioned gel lane.
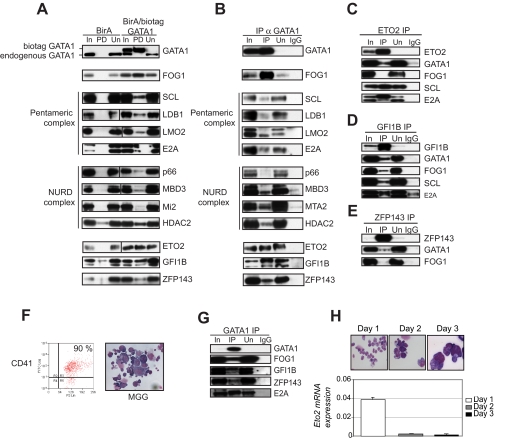
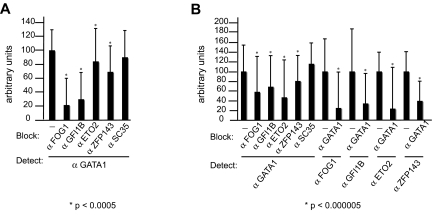
 ). Data shown in panels D and E are the average of 3 independent experiments, and error bars represent 2 SD.
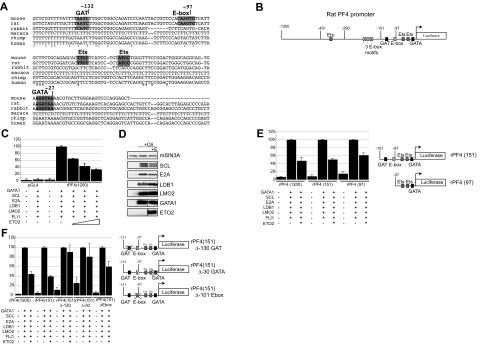
Similar articles
-
GATA1 in Normal and Pathologic Megakaryopoiesis and Platelet Development.Adv Exp Med Biol. 2024;1459:261-287. doi: 10.1007/978-3-031-62731-6_12. Adv Exp Med Biol. 2024. PMID: 39017848 Review.
-
GATA1-mediated megakaryocyte differentiation and growth control can be uncoupled and mapped to different domains in GATA1.Mol Cell Biol. 2005 Oct;25(19):8592-606. doi: 10.1128/MCB.25.19.8592-8606.2005. Mol Cell Biol. 2005. PMID: 16166640 Free PMC article.
-
Characterization of a megakaryocyte-specific enhancer of the key hemopoietic transcription factor GATA1.J Biol Chem. 2006 May 12;281(19):13733-13742. doi: 10.1074/jbc.M602052200. Epub 2006 Mar 20. J Biol Chem. 2006. PMID: 16551635
-
FOG1 requires NuRD to promote hematopoiesis and maintain lineage fidelity within the megakaryocytic-erythroid compartment.Blood. 2010 Mar 18;115(11):2156-66. doi: 10.1182/blood-2009-10-251280. Epub 2010 Jan 11. Blood. 2010. PMID: 20065294 Free PMC article.
-
Cellular and molecular biology of megakaryocyte differentiation in the absence of lineage-restricted transcription factors.Stem Cells. 1998;16 Suppl 2:91-5. doi: 10.1002/stem.5530160712. Stem Cells. 1998. PMID: 11012181 Review.
Cited by
-
GATA1 in Normal and Pathologic Megakaryopoiesis and Platelet Development.Adv Exp Med Biol. 2024;1459:261-287. doi: 10.1007/978-3-031-62731-6_12. Adv Exp Med Biol. 2024. PMID: 39017848 Review.
-
Uncoupling VEGFA functions in arteriogenesis and hematopoietic stem cell specification.Dev Cell. 2013 Jan 28;24(2):144-58. doi: 10.1016/j.devcel.2012.12.004. Epub 2013 Jan 11. Dev Cell. 2013. PMID: 23318133 Free PMC article.
-
Gene profiling of the erythro- and megakaryoblastic leukaemias induced by the Graffi murine retrovirus.BMC Med Genomics. 2010 Jan 26;3:2. doi: 10.1186/1755-8794-3-2. BMC Med Genomics. 2010. PMID: 20102610 Free PMC article.
-
Transcription factor genetics and biology in predisposition to bone marrow failure and hematological malignancy.Front Oncol. 2023 Jun 12;13:1183318. doi: 10.3389/fonc.2023.1183318. eCollection 2023. Front Oncol. 2023. PMID: 37377909 Free PMC article. Review.
-
The leukemia associated nuclear corepressor ETO homologue genes MTG16 and MTGR1 are regulated differently in hematopoietic cells.BMC Mol Biol. 2012 Mar 23;13:11. doi: 10.1186/1471-2199-13-11. BMC Mol Biol. 2012. PMID: 22443175 Free PMC article.
References
-
- Patient RK, McGhee JD. The GATA family (vertebrates and invertebrates). Curr Opin Genet Dev. 2002;12:416–422. - PubMed
-
- Galloway JL, Wingert RA, Thisse C, Thisse B, Zon LI. Loss of gata1 but not gata2 converts erythropoiesis to myelopoiesis in zebrafish embryos. Dev Cell. 2005;8:109–116. - PubMed
-
- Rhodes J, Hagen A, Hsu K, et al. Interplay of pu. 1 and gata1 determines myelo-erythroid progenitor cell fate in zebrafish. Dev Cell. 2005;8:97–108. - PubMed
-
- Iwasaki H, Mizuno S, Wells RA, Cantor AB, Watanabe S, Akashi K. GATA-1 converts lymphoid and myelomonocytic progenitors into the megakaryocyte/erythrocyte lineages. Immunity. 2003;19:451–462. - PubMed
Publication types
MeSH terms
Substances
Grants and funding
LinkOut - more resources
Full Text Sources
Molecular Biology Databases
Research Materials
Miscellaneous
