

FGF15 promotes neurogenesis and opposes FGF8 function during neocortical development
- PMID: 18625063
- PMCID: PMC2492847
- DOI: 10.1186/1749-8104-3-17
FGF15 promotes neurogenesis and opposes FGF8 function during neocortical development
Erratum in
- Neural Develop. 2008 Nov 5;3: 31.. McWhirter, John R [added]
Abstract
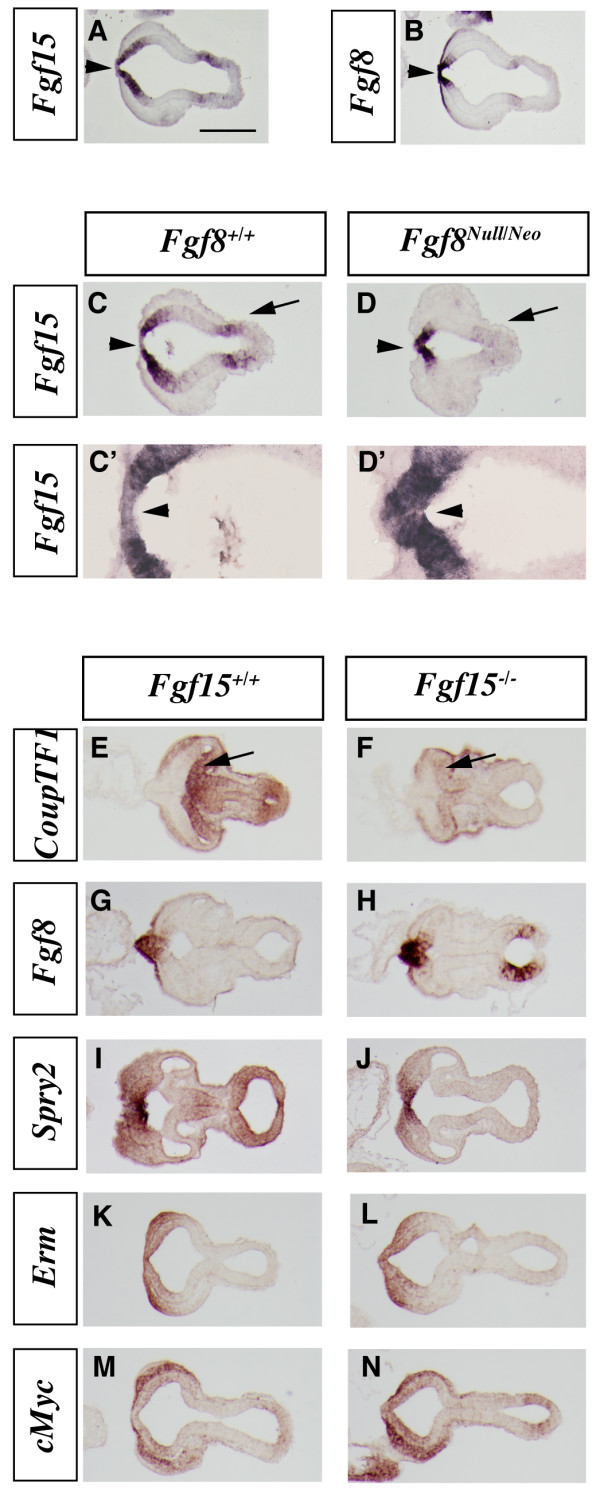
Background: Growth, differentiation and regional specification of telencephalic domains, such as the cerebral cortex, are regulated by the interplay of secreted proteins produced by patterning centers and signal transduction systems deployed in the surrounding neuroepithelium. Among other signaling molecules, members of the fibroblast growth factor (FGF) family have a prominent role in regulating growth, differentiation and regional specification. In the mouse telencephalon the rostral patterning center expresses members of the Fgf family (Fgf8, Fgf15, Fgf17, Fgf18). FGF8 and FGF17 signaling have major roles in specification and morphogenesis of the rostroventral telencephalon, whereas the functions of FGF15 and FGF18 in the rostral patterning center have not been established.
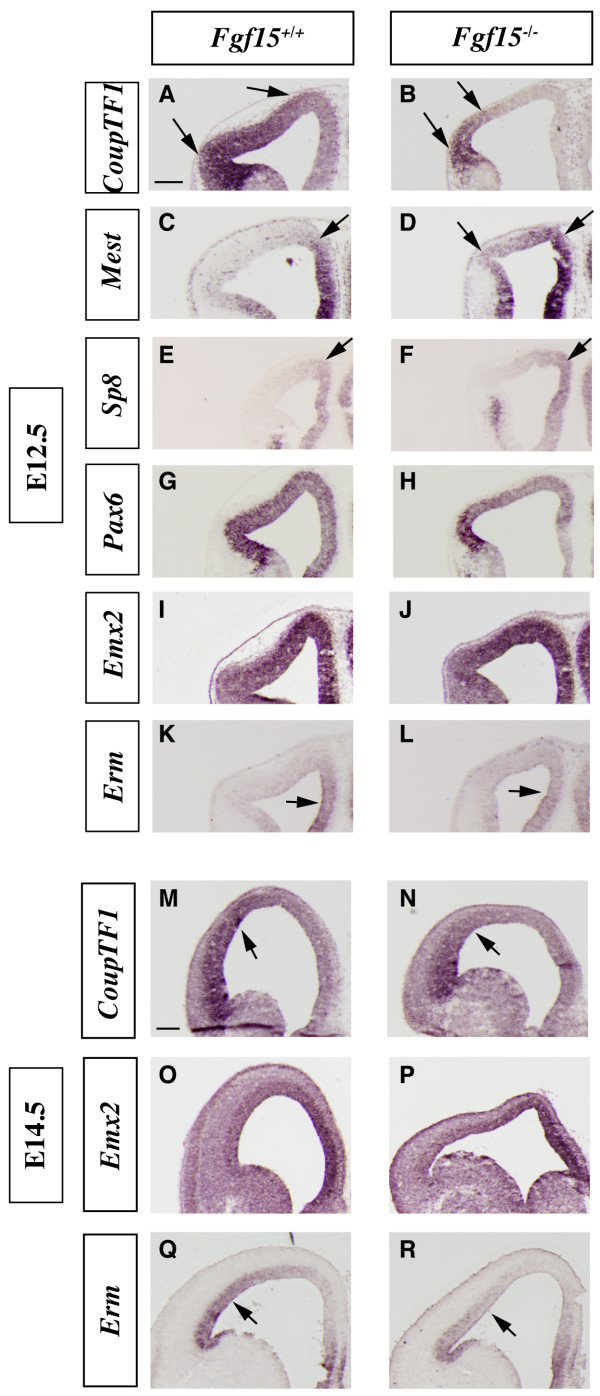
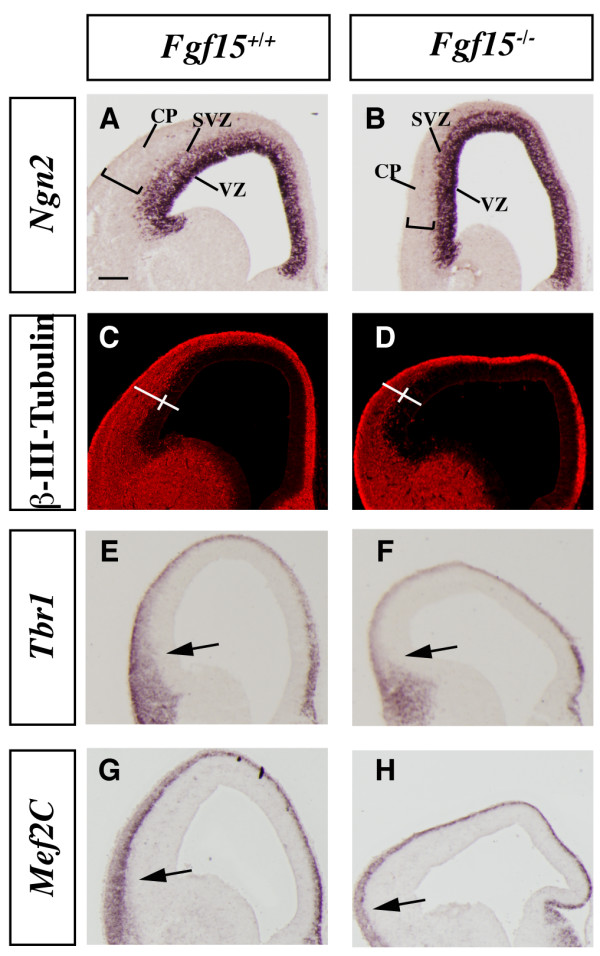
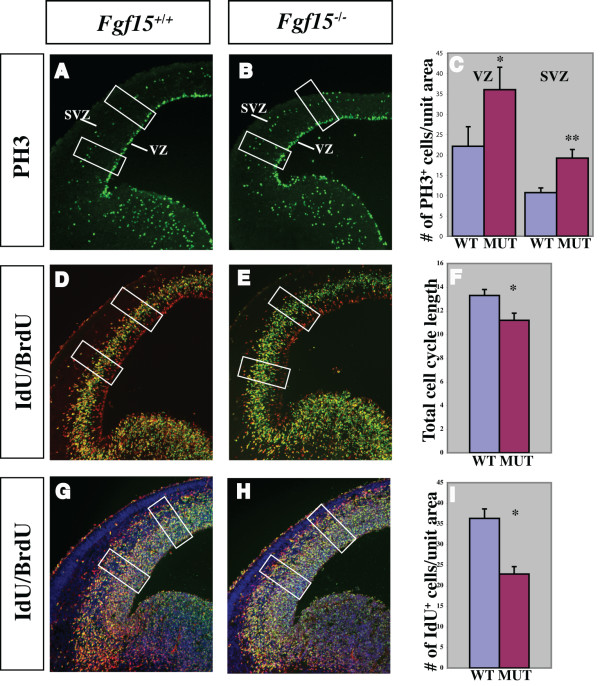
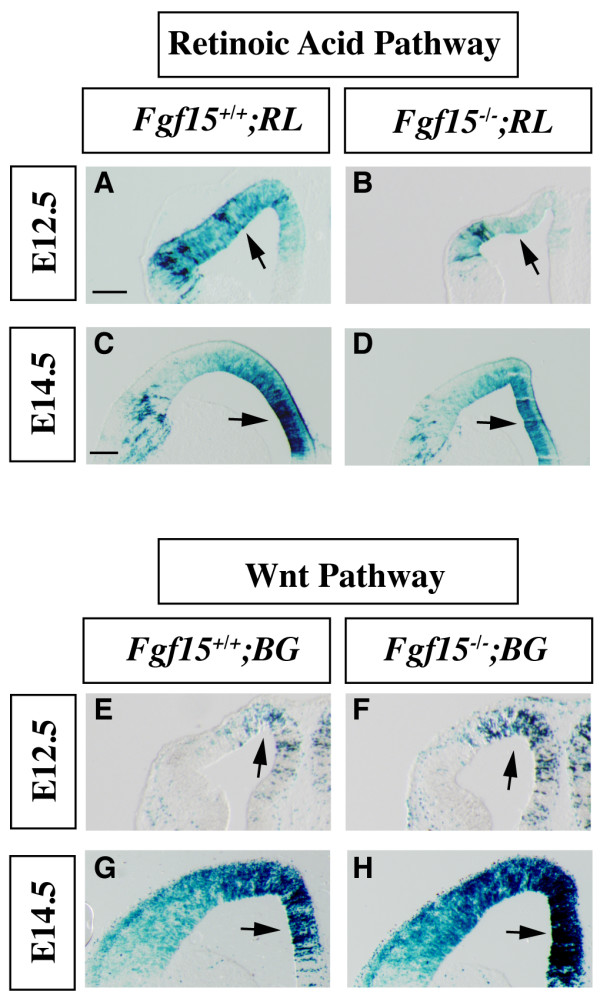
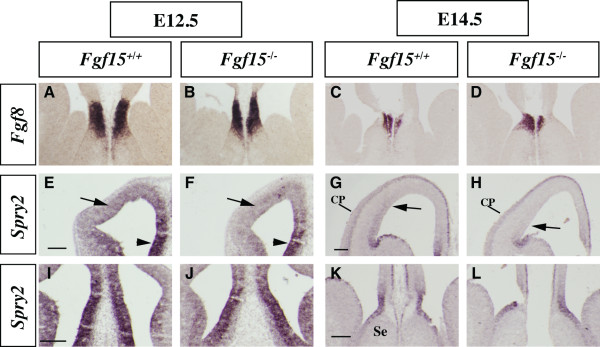
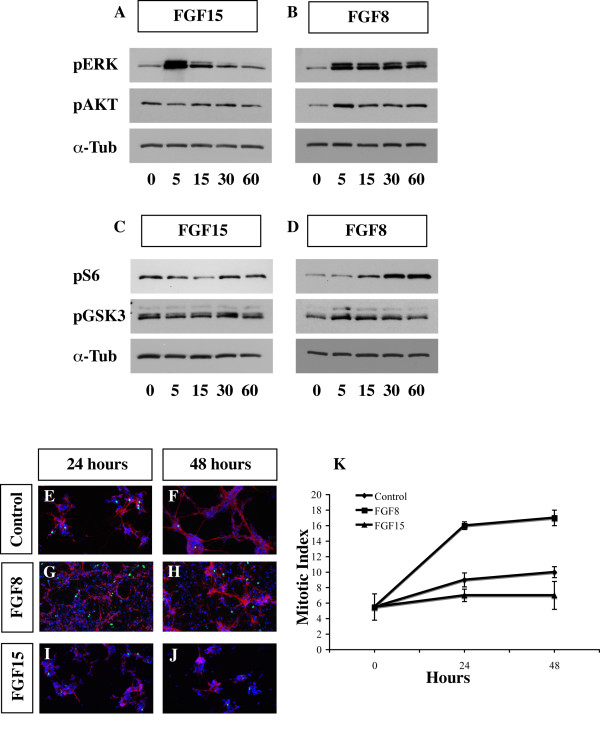
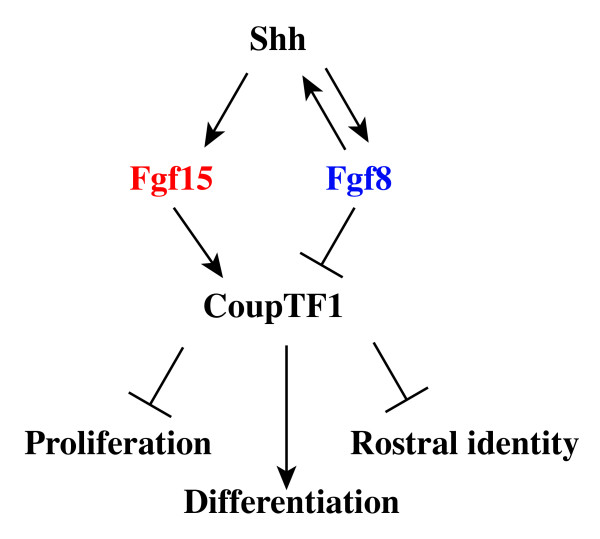
Results: Using Fgf15-/- mutant mice, we provide evidence that FGF15 suppresses proliferation, and that it promotes differentiation, expression of CoupTF1 and caudoventral fate; thus, reducing Fgf15 and Fgf8 dosage have opposite effects. Furthermore, we show that FGF15 and FGF8 differentially phosphorylate ERK (p42/44), AKT and S6 in cultures of embryonic cortex. Finally, we show that FGF15 inhibits proliferation in cortical cultures.
Conclusion: FGF15 and FGF8 have distinct signaling properties, and opposite effects on neocortical patterning and differentiation; FGF15 promotes CoupTF1 expression, represses proliferation and promotes neural differentiation.
Figures
Similar articles
-
Subregional specification of embryonic stem cell-derived ventral telencephalic tissues by timed and combinatory treatment with extrinsic signals.J Neurosci. 2011 Feb 2;31(5):1919-33. doi: 10.1523/JNEUROSCI.5128-10.2011. J Neurosci. 2011. PMID: 21289201 Free PMC article.
-
Fgf signaling controls the telencephalic distribution of Fgf-expressing progenitors generated in the rostral patterning center.Neural Dev. 2015 Mar 31;10:8. doi: 10.1186/s13064-015-0037-7. Neural Dev. 2015. PMID: 25889070 Free PMC article.
-
Coordinate expression of Fgf8, Otx2, Bmp4, and Shh in the rostral prosencephalon during development of the telencephalic and optic vesicles.Neuroscience. 2001;108(2):183-206. doi: 10.1016/s0306-4522(01)00411-0. Neuroscience. 2001. PMID: 11734354
-
Numerous isoforms of Fgf8 reflect its multiple roles in the developing brain.J Cell Physiol. 2011 Jul;226(7):1722-6. doi: 10.1002/jcp.22587. J Cell Physiol. 2011. PMID: 21506104 Free PMC article. Review.
-
Area patterning of the mammalian cortex.Neuron. 2007 Oct 25;56(2):252-69. doi: 10.1016/j.neuron.2007.10.010. Neuron. 2007. PMID: 17964244 Review.
Cited by
-
Molecular regulation of striatal development: a review.Anat Res Int. 2012;2012:106529. doi: 10.1155/2012/106529. Epub 2012 Jan 26. Anat Res Int. 2012. PMID: 22567304 Free PMC article.
-
HSV-1 triggers paracrine fibroblast growth factor response from cortical brain cells via immediate-early protein ICP0.J Neuroinflammation. 2019 Dec 2;16(1):248. doi: 10.1186/s12974-019-1647-5. J Neuroinflammation. 2019. PMID: 31791351 Free PMC article.
-
Evolution of the neocortex: a perspective from developmental biology.Nat Rev Neurosci. 2009 Oct;10(10):724-35. doi: 10.1038/nrn2719. Nat Rev Neurosci. 2009. PMID: 19763105 Free PMC article. Review.
-
Three phases of DiGeorge/22q11 deletion syndrome pathogenesis during brain development: patterning, proliferation, and mitochondrial functions of 22q11 genes.Int J Dev Neurosci. 2011 May;29(3):283-94. doi: 10.1016/j.ijdevneu.2010.08.005. Epub 2010 Sep 15. Int J Dev Neurosci. 2011. PMID: 20833244 Free PMC article. Review.
-
Fgf10 regulates transition period of cortical stem cell differentiation to radial glia controlling generation of neurons and basal progenitors.Neuron. 2009 Jul 16;63(1):48-62. doi: 10.1016/j.neuron.2009.06.006. Neuron. 2009. PMID: 19607792 Free PMC article.
References
-
- Lee SM, Tole S, Grove E, McMahon AP. A local Wnt-3a signal is required for development of the mammalian hippocampus. Development. 2000;127:457–467. - PubMed
-
- Galceran J, Miyashita-Lin EM, Devaney E, Rubenstein JL, Grosschedl R. Hippocampus development and generation of dentate gyrus granule cells is regulated by LEF1. Development. 2000;127:469–482. - PubMed
-
- Hebert JM, Hayhurst M, Marks ME, Kulessa H, Hogan BL, McConnell SK. BMP ligands act redundantly to pattern the dorsal telencephalic midline. Genesis. 2003;35:214–219. - PubMed
-
- Theil T, Alvarez-Bolado G, Walter A, Ruther U. Gli3 is required for Emx gene expression during dorsal telencephalon development. Development. 1999;126:3561–3571. - PubMed
-
- Tole S, Ragsdale CW, Grove EA. Dorsoventral patterning of the telencephalon is disrupted in the mouse mutant extra-toes(J) Dev Biol. 2000;217:254–265. - PubMed
Publication types
MeSH terms
Substances
Grants and funding
LinkOut - more resources
Full Text Sources
Other Literature Sources
Molecular Biology Databases
Miscellaneous
