Global analysis of in vivo Foxa2-binding sites in mouse adult liver using massively parallel sequencing
- PMID: 18611952
- PMCID: PMC2504304
- DOI: 10.1093/nar/gkn382
Global analysis of in vivo Foxa2-binding sites in mouse adult liver using massively parallel sequencing
Abstract
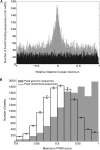
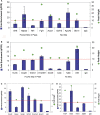
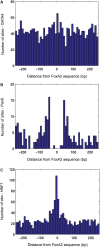
Foxa2 (HNF3 beta) is a one of three, closely related transcription factors that are critical to the development and function of the mouse liver. We have used chromatin immunoprecipitation and massively parallel Illumina 1G sequencing (ChIP-Seq) to create a genome-wide profile of in vivo Foxa2-binding sites in the adult liver. More than 65% of the approximately 11.5 k genomic sites associated with Foxa2 binding, mapped to extended gene regions of annotated genes, while more than 30% of intragenic sites were located within first introns. 20.5% of all sites were further than 50 kb from any annotated gene, suggesting an association with novel gene regions. QPCR analysis demonstrated a strong positive correlation between peak height and fold enrichment for Foxa2-binding sites. We measured the relationship between Foxa2 and liver gene expression by overlapping Foxa2-binding sites with a SAGE transcriptome profile, and found that 43.5% of genes expressed in the liver were also associated with Foxa2 binding. We also identified potential Foxa2-interacting transcription factors whose motifs were enriched near Foxa2-binding sites. Our comprehensive results for in vivo Foxa2-binding sites in the mouse liver will contribute to resolving transcriptional regulatory networks that are important for adult liver function.
Figures


Similar articles
-
Cis-regulatory modules in the mammalian liver: composition depends on strength of Foxa2 consensus site.Nucleic Acids Res. 2008 Jul;36(12):4149-57. doi: 10.1093/nar/gkn366. Epub 2008 Jun 13. Nucleic Acids Res. 2008. PMID: 18556755 Free PMC article.
-
Genome-wide analyses of ChIP-Seq derived FOXA2 DNA occupancy in liver points to genetic networks underpinning multiple complex traits.J Clin Endocrinol Metab. 2014 Aug;99(8):E1580-5. doi: 10.1210/jc.2013-4503. Epub 2014 May 30. J Clin Endocrinol Metab. 2014. PMID: 24878043 Free PMC article.
-
Molecular interactions between HNF4a, FOXA2 and GABP identified at regulatory DNA elements through ChIP-sequencing.Nucleic Acids Res. 2009 Dec;37(22):7498-508. doi: 10.1093/nar/gkp823. Nucleic Acids Res. 2009. PMID: 19822575 Free PMC article.
-
Genome-wide relationship between histone H3 lysine 4 mono- and tri-methylation and transcription factor binding.Genome Res. 2008 Dec;18(12):1906-17. doi: 10.1101/gr.078519.108. Epub 2008 Sep 11. Genome Res. 2008. PMID: 18787082 Free PMC article.
-
Extracting transcription factor targets from ChIP-Seq data.Nucleic Acids Res. 2009 Sep;37(17):e113. doi: 10.1093/nar/gkp536. Epub 2009 Jun 24. Nucleic Acids Res. 2009. PMID: 19553195 Free PMC article.
Cited by
-
Identification of pathways directly regulated by SHORT VEGETATIVE PHASE during vegetative and reproductive development in Arabidopsis.Genome Biol. 2013 Jun 11;14(6):R56. doi: 10.1186/gb-2013-14-6-r56. Genome Biol. 2013. PMID: 23759218 Free PMC article.
-
TherMos: Estimating protein-DNA binding energies from in vivo binding profiles.Nucleic Acids Res. 2013 Jun;41(11):5555-68. doi: 10.1093/nar/gkt250. Epub 2013 Apr 16. Nucleic Acids Res. 2013. PMID: 23595148 Free PMC article.
-
Locus co-occupancy, nucleosome positioning, and H3K4me1 regulate the functionality of FOXA2-, HNF4A-, and PDX1-bound loci in islets and liver.Genome Res. 2010 Aug;20(8):1037-51. doi: 10.1101/gr.104356.109. Epub 2010 Jun 15. Genome Res. 2010. PMID: 20551221 Free PMC article.
-
Annotating genomes with massive-scale RNA sequencing.Genome Biol. 2008;9(12):R175. doi: 10.1186/gb-2008-9-12-r175. Epub 2008 Dec 16. Genome Biol. 2008. PMID: 19087247 Free PMC article.
-
Hepatic TET3 contributes to type-2 diabetes by inducing the HNF4α fetal isoform.Nat Commun. 2020 Jan 17;11(1):342. doi: 10.1038/s41467-019-14185-z. Nat Commun. 2020. PMID: 31953394 Free PMC article.
References
-
- Ang SL, Wierda A, Wong D, Stevens KA, Cascio S, Rossant J, Zaret KS. The formation and maintenance of the definitive endoderm lineage in the mouse: involvement of HNF3/forkhead proteins. Development. 1993;119:1301–1315. - PubMed
-
- Wolfrum C, Asilmaz E, Luca E, Friedman JM, Stoffel M. Foxa2 regulates lipid metabolism and ketogenesis in the liver during fasting and in diabetes. Nature. 2004;432:1027–1032. - PubMed
-
- Lai E, Prezioso VR, Smith E, Litvin O, Costa RH, Darnell J.E., Jr HNF-3A, a hepatocyte-enriched transcription factor of novel structure is regulated transcriptionally. Genes Dev. 1990;4:1427–1436. - PubMed
Publication types
MeSH terms
Substances
LinkOut - more resources
Full Text Sources
Other Literature Sources
Molecular Biology Databases

