. 2008 Sep;22(9):2162-75.
doi: 10.1210/me.2008-0079. Epub 2008 Jul 7.

p66shc negatively regulates insulin-like growth factor I signal transduction via inhibition of p52shc binding to Src homology 2 domain-containing protein tyrosine phosphatase substrate-1 leading to impaired growth factor receptor-bound protein-2 membrane recruitment

Affiliations

p66shc negatively regulates insulin-like growth factor I signal transduction via inhibition of p52shc binding to Src homology 2 domain-containing protein tyrosine phosphatase substrate-1 leading to impaired growth factor receptor-bound protein-2 membrane recruitment

Gang Xi et al. Mol Endocrinol. 2008 Sep.

Abstract

Our previous studies have indicated an essential role of p52shc in mediating IGF-I activation of MAPK in smooth muscle cells (SMC). However, the role of the p66 isoform of shc in IGF-I signal transduction is unclear. In the current study, two approaches were employed to investigate the role of p66shc in mediating IGF-I signaling. Knockdown p66shc by small interfering RNA enhanced IGF-I-stimulated p52shc tyrosine phosphorylation and growth factor receptor-bound protein-2 (Grb2) association, resulting in increased IGF-I-dependent MAPK activation. This was associated with enhanced IGF-I-stimulated cell proliferation. In contrast, knockdown of p66shc did not affect IGF-I-stimulated IGF-I receptor tyrosine phosphorylation. Overexpression of p66shc impaired IGF-I-stimulated p52shc tyrosine phosphorylation and p52shc-Grb2 association. In addition, IGF-I-dependent MAPK activation was also impaired, and SMC proliferation in response to IGF-I was inhibited. IGF-I-dependent cell migration was enhanced by p66shc knockdown and attenuated by p66shc overexpression. Mechanistic studies indicated that p66shc inhibited IGF-I signal transduction via competitively inhibiting the binding of Src homology 2 domain-containing protein tyrosine phosphatase-2 (SHP-2) to SHP substrate-1 (SHPS-1), leading to the disruption of SHPS-1/SHP-2/Src/p52shc complex formation, an event that has been shown previously to be essential for p52shc phosphorylation and Grb2 recruitment. These findings indicate that p66shc functions to negatively regulate the formation of a signaling complex that is required for p52shc activation in response to IGF-I, thus leading to attenuation of IGF-I-stimulated cell proliferation and migration.


Figures

Figure 1
Figure 1
Knockdown of p66shc Enhances IGF-I-Dependent p52shc Tyrosine Phosphorylation and Grb2 Association A, pSMC were transduced with empty vector or the p66shc shRNA template plasmid and analyzed for shc protein expression. Cell lysates were immunoblotted with anti-shc antibody. The arrows denote the p66shc, p52shc, and p46shc bands. B, Quiescent pSMC were stimulated with IGF-I (100 ng/ml) for the indicated times. Shc phosphorylation was determined by immunoprecipitating cell lysates with an anti-shc antibody and then immunoblotting with anti-p-Tyr (PY99) antibody. To control for loading, the blot was reprobed with an anti-shc antibody. The arrows denote the p66shc and p52shc bands. The protein levels were quantified using scanning densitometry. Each point represents the phosphorylated shc value divided by total shc and is the pool of at least three independent experiments, expressed as the mean ± sem. *, P < 0.05 indicates a significant difference at 10 and 20 min after IGF-I stimulation in p66shc knockdown cells compared with EVC cells. C, Cells were serum starved for 16–18 h and then stimulated with IGF-I (100 ng/ml) for the indicated times. The cell lysates were immunoprecipitated with anti-Grb2 and immunoblotted with anti-shc. To control the loading, the blot was stripped and reprobed for anti-Grb2. The relative amount of p52shc associated with Grb2 was quantified using scanning densitometry, and the results were normalized by the Grb2 protein level as was done previously. *, P < 0.05 indicates that knockdown p66shc significantly enhances IGF-I-stimulated p52shc bound to Grb2, compared with control cells.
Figure 2
Figure 2
Knockdown of p66shc Does Not Change IGF-I-Stimulated IGF-IR Tyrosine Phosphorylation Cells were serum starved for 16–18 h before the addition of IGF-I (100 ng/ml) for the indicated times. The cell lysates were immunoprecipitated with anti-IGF-IR antibody and immunoblotted with anti-p-Tyr (PY99) antibody. To control the loading, the blot was stripped and reprobed with anti-IGF-IR antibody. The figure is representative of three independent experiments.
Figure 3
Figure 3
Overexpression of p66shc Impairs IGF-I-Stimulated p52shc Tyrosine Phosphorylation and Grb2 Association A, pSMC were transducted with pLenti-LacZ or pLenti-HA p66shc vector. Both cell types were serum starved for 16–18 h and analyzed for p66shc and HA protein expression. Cell lysates were immunoblotted with anti-shc or anti-HA antibodies. The arrows denote the exogenous (Exo) and endogenous (Endo) p66shc, p52shc, and p46shc bands. B, Quiescent pSMC were stimulated with IGF-I (100 ng/ml) at indicated times. Shc phosphorylation was determined by immunoprecipitating cell lysates with an anti-shc antibody and then immunoblotting with an anti-p-Tyr (PY99) antibody. For a loading control, the blot was reprobed with anti-shc antibody. The arrows denote the p66 and p52shc bands. The protein levels were quantified using scanning densitometry. Each point represents the phosphorylated shc value divided by total shc and is the pool of at least three independent experiments, expressed as the mean ± sem. *, P < 0.05 indicates a significant difference at 5, 10, and 20 min after IGF-I stimulation in p66shc overexpression cells compared with LacZ control cells. C, Cells were serum starved for 16–18 h before the addition of IGF-I (100 ng/ml) for the indicated times. The cell lysates were immunoprecipitated with anti-Grb2 polyclonal antibody and immunoblotted with anti-shc antibody. To control the loading, the blot was stripped and reprobed with anti-Grb2 monoclonal antibody. The arrows denote the p66 and p52shc bands. The figure is representative of three independent experiments. The relative amount of p52shc associated with Grb2 was quantified using scanning densitometry, and the results were normalized by the Grb2 protein level. *, P < 0.05 indicates that overexpression of p66shc significantly impairs IGF-I-stimulated p52shc binding to Grb2, compared with LacZ control cells.
Figure 4
Figure 4
p66shc Negatively Regulates IGF-I-Stimulated MAPK Activation in pSMC After IGF-I (100 ng/ml) treatment for the indicated times, cell lysates from EVC and p66shc shRNA template (p66shc Si) (A) or pLenti-LacZ (LacZ) and pLenti-HA p66shc (p66shc O) vector (B) transduced cells were used to determine the activation of Erk1/2 by probing with anti-phospho-Erk1/2 antibody. The blots were stripped and reprobed with an anti-Erk1/2 antibody to control for loading differences. The phosphorylation of Erk1/2 normalized by the protein levels was quantified using scanning densitometry. Each point is the mean of at least three independent experiments and is indicated as mean ± sem. *, P < 0.05; ***, P < 0.001 indicates a significant difference between IGF-I-stimulated activation of Erk1/2 in p66shc knockdown or overexpressing cells compared with control cells, respectively.
Figure 5
Figure 5
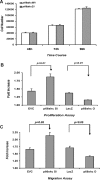
p66shc Negatively Regulates IGF-I-Stimulated Proliferation and Migration in pSMC Cell proliferation and migration were determined as described in Materials and Methods. A, Comparison of the cell proliferative response in serum containing medium between p66shc knockdown (p66shc Si) and control (p66shc Wt) cells. B, Comparison of the cell proliferative response to IGF-I between p66shc knockdown (p66shc Si) and control cells (EVC) and p66shc-overexpressing (p66shc O) and control cells (LacZ). Each bar indicates the fold increase over basal and represents the pool of at least three independent experiments. P < 0.01 indicates that knockdown p66shc significantly enhances IGF-I-dependent cell proliferation and overexpression of p66shc significantly impairs IGF-I-stimulated cell proliferation, compared with control cells, respectively. C, Comparison of IGF-I-stimulated cell migration between p66shc knockdown (p66shc Si) and control cells (EVC) and p66shc-overexpressing (p66shc O) and control cells (LacZ), respectively. Each bar indicates the fold increase over basal and represents the pool of at least three independent experiments. P < 0.05 indicates that p66shc knockdown significantly enhances IGF-I-dependent cell migration and overexpression of p66shc significantly attenuates it, compared with control cells, respectively.
Figure 6
Figure 6
Knockdown of p66shc Enhances IGF-I-Stimulated SHPS-1/SHP-2/Src/p52shc/Grb2 Complex Formation in pSMC Quiescent pSMC were stimulated with IGF-I (100 ng/ml) for the indicated times. A, The cell lysates were immunoprecipitated with anti-SHPS-1 polyclonal antibody and immunoblotted with anti-p-Tyr (PY99), -shc, and -Grb2 antibody, respectively. To control for loading, the blot was stripped and immunoblotted with anti-SHPS-1 antibody. B, The cell lysates were immunoprecipitated with anti-SHPS-1 polyclonal antibody and immunoblotted with anti-SHP-2 and c-Src antibodies, respectively. To control for loading, the blot was stripped and immunoblotted with anti-SHPS-1 antibody. C, The cell lysates were immunoprecipitated with anti-c-Src antibody and immunoblotted with anti-SHPS-1, -SHP-2, and -shc antibody, respectively. As a loading control, the blot was stripped and immunoblotted with anti-c-Src antibody. D, The cell lysates were immunoprecipitated with anti-SHP-2 antibody and immunoblotted with anti-SHPS-1, -shc, and -Src antibodies, respectively. As a loading control, the blot was stripped and immunoblotted with anti-SHP-2 antibody. The figures are representative of three independent experiments.
Figure 7
Figure 7
Overexpression p66shc Impairs IGF-I-Stimulated SHPS-1/SHP-2/Src/p52shc/Grb2 Complex Formation in pSMC Quiescent pSMC were stimulated with IGF-I (100 ng/ml) for the indicated times. A, The cell lysates were immunoprecipitated with anti-SHPS-1 polyclonal antibody and immunoblotted with anti-p-Tyr (PY99), -shc, and -Grb2 antibodies, respectively. For a loading control, the blot was stripped and immunoblotted with anti-SHPS-1 antibody. B, The cell lysates were immunoprecipitated with anti-SHPS-1 polyclonal antibody and immunoblotted with anti-SHP-2 and -c-Src antibodies, respectively. To control for loading, the blot was stripped and immunoblotted with anti-SHPS-1 antibody. C, The cell lysates were immunoprecipitated with anti-c-Src antibody and immunoblotted with anti-SHPS-1, -SHP-2, and -shc antibody, respectively. As a loading control, the blot was stripped and immunoblotted with anti-c-Src antibody. D, The cell lysates were immunoprecipitated with anti-SHP-2 antibody and immunoblotted with anti-SHPS-1, -shc, and -c-Src antibody, respectively. As a loading control, the blot was stripped and immunoblotted with anti-SHP-2 antibody. The figures are representative of three independent experiments.
Figure 8
Figure 8
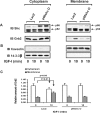
Overexpression of p66shc Impairs IGF-I-Stimulated p52shc and Grb2 Membrane Recruitment in pSMC Quiescent pSMC were stimulated with IGF-I for 10 min and fractionated as described in Materials and Methods. A, Equal amounts of cytoplasmic and membrane fraction protein were analyzed for shc or Grb2 by immunoblotting. B, To confirm the validity of the cell fractionation procedure, equal amount of protein from the different fractions were analyzed to determine the presence of marker proteins for membrane (anti-caveolin) and cytoplasmic (anti-14-3-3β) fractions, respectively. The figures are representative of three independent experiments. C, Comparison of total Grb2 protein distribution after IGF-I stimulation between p66shc-overexpressing (p66shc O) cells and control (LacZ) cells. Each bar indicates the relative amount of Grb2 (Grb2 protein/marker protein) in each fraction and represents the pool of three independent experiments. P < 0.05 and P < 0.01 indicate IGF-I stimulation significantly decreases Grb2 protein in cytoplasmic fraction and increases Grb2 protein to be recruited to membrane fraction in control cells.

Similar articles

Cited by

References

    1. Luzi L, Confalonieri S, Di Fiore PP, Pelicci PG 2000 Evolution of Shc functions from nematode to human. Curr Opin Genet Dev 10:668–674 - PubMed
    1. Pelicci G, Lanfrancone L, Grignani F, McGlade J, Cavallo F, Forni G, Nicoletti I, Pawson T, Pelicci PG 1992 A novel transforming protein (SHC) with an SH2 domain is implicated in mitogenic signal transduction. Cell 70:93–104 - PubMed
    1. Conti L, Sipione S, Magrassi L, Bonfanti L, Rigamonti D, Pettirossi V, Peschanski M, Haddad B, Pelicci P, Milanesi G, Pelicci G, Cattaneo E 2001 Shc signaling in differentiating neural progenitor cells. Nat Neurosci 4:579–586 - PubMed
    1. Migliaccio E, Mele S, Salcini AE, Pelicci G, Lai KM, Superti-Furga G, Pawson T, Di Fiore PP, Lanfrancone L, Pelicci PG 1997 Opposite effects of the p52shc/p46shc and p66shc splicing isoforms on the EGF receptor-MAP kinase-fos signalling pathway. EMBO J 16:706–716 - PMC - PubMed
    1. Ishihara H, Sasaoka T, Wada T, Ishiki M, Haruta T, Usui I, Iwata M, Takano A, Uno T, Ueno E, Kobayashi M 1998 Relative involvement of Shc tyrosine 239/240 and tyrosine 317 on insulin induced mitogenic signaling in rat1 fibroblasts expressing insulin receptors. Biochem Biophys Res Commun 252:139–144 - PubMed

Publication types

MeSH terms

Substances