. 2008 Aug;9(8):857-65.
doi: 10.1038/ni.1636. Epub 2008 Jul 11.

The NALP3 inflammasome is involved in the innate immune response to amyloid-beta

Affiliations

The NALP3 inflammasome is involved in the innate immune response to amyloid-beta

Annett Halle et al. Nat Immunol. 2008 Aug.

Abstract

The fibrillar peptide amyloid-beta (A beta) has a chief function in the pathogenesis of Alzheimer's disease. Interleukin 1 beta (IL-1 beta) is a key cytokine in the inflammatory response to A beta. Insoluble materials such as crystals activate the inflammasome formed by the cytoplasmic receptor NALP3, which results in the release of IL-1 beta. Here we identify the NALP3 inflammasome as a sensor of A beta in a process involving the phagocytosis of A beta and subsequent lysosomal damage and release of cathepsin B. Furthermore, the IL-1 beta pathway was essential for the microglial synthesis of proinflammatory and neurotoxic factors, and the inflammasome, caspase-1 and IL-1 beta were critical for the recruitment of microglia to exogenous A beta in the brain. Our findings suggest that activation of the NALP3 inflammasome is important for inflammation and tissue damage in Alzheimer's disease.


Figures

Figure 1
Figure 1
Fibrillar Aβ induces the caspase-1-dependent release of interleukin-1β. (a,b) ELISA of the release of IL-1β by wild-type (WT) primary mouse microglia (a) and immortalized mouse microglia (b) left untreated (Ctl) or stimulated with fibrillar Aβ (10 µM) or revAβ (10 µM). (c) Confocal microscopy (above) and flow cytometry (below) of activated caspase-1 (green) in wild-type immortalized microglial cells left untreated or incubated for 4 h with Aβ (10 µM), revAβ (10 µM) or ATP (1 mM); caspase-1 activation was visualized by incubation with a fluorescent cell-permeable probe that binds only to activated caspase-1 (FLICA), and cell membranes were stained for cholera toxin subunit B (red). Scale bar, 10 µm. Gray filled histograms, unstimulated control cells. (d) Immunoblot analysis of caspase-1 (p10) cleavage in LPS-primed wild-type bone marrow–derived macrophages stimulated with Aβ (1, 5 and 10 µM), revAβ (10 µM) or ATP (5 mM) or transfected with poly(dA:dT) (dAdT; 1.6 µg). p45, full-length pro-form of caspase-1. (e) ELISA of the release of IL-1β into supernatants of wild-type immortalized microglial cells left unstimulated or stimulated for 6 h with Aβ in the presence of increasing amounts of a caspase-1-specific inhibitor (z-YVAD-fmk). Data are representative of experiments done three times (error bars (a,b,e), s.e.m.).
Figure 2
Figure 2
Fibrillar Aβ activates the NALP3 inflammasome. (a) Confocal microscopy of wild-type immortalized microglial cells stably transduced with CFP-ASC, left unstimulated or stimulated for 4 h with revAβ (10 µM), Aβ (10 µM) or ATP (1 mM) in duplicate after being primed with LPS; cell membranes were stained with fluorescent choleratoxin subunit B (Ctb; green), and arrowheads indicate clusters of CFP-ASC (red). Scale bars, 10 µm. (b) Quantification of the images in a (mean and s.e.m. of five random fields). Data are representative of experiments done twice with nearly identical results. (c) ELISA of the release of IL-1β into the supernatants of LPS-primed bone marrow–derived wild-type, NALP3-deficient (NALP3-KO) and ASC-deficient (ASC-KO) macrophages left unstimulated or stimulated with Aβ (1, 5 or 10 µM), revAβ (10 µM) or ATP (5 mM) or transfected with poly(dA:dT) (200 ng) for 6 h. Data are representative of experiments done twice (error bars, s.e.m.).
Figure 3
Figure 3
Phagocytosis of Aβ is necessary for IL-1β release and induces lysosomal damage. (a) ELISA of the release of IL-1β into supernatants of wild-type immortalized microglia treated with cytochalasin D during stimulation with Aβ or ATP. (b,c) Confocal microscopy of immortalized microglia incubated for 4 h with FITC-labeled Aβ (10 µM) and then processed for immunocytochemistry; cell membranes were visualized with cholera toxin subunit B and lysosomes were stained with anti-LAMP-1. Arrows indicate LAMP-1-positive lysosomes containing Aβ; z-series (top right and bottom left, c) were taken through the dashed lines (top left, c). Scale bars, 10 µm. (d) Lysosomal diameter in unstimulated cells (Ctl) and cells that incorporated Aβ (n = 50 cells per group). (e) Confocal microscopy of lysosomal integrity in wild-type microglia incubated with acidophilic lysomotropic dye (LysoTracker Red; red), and then stimulated with HiLyte 488–conjugated Aβ (green). Arrowheads indicate phagocytosed Aβ overlaid with the lysomotropic dye in small lysosomes; arrows indicate enlarged Aβ-containing dye-negative lysosomes, indicative of perturbation of lysosomal integrity. Scale bar, 10 µm. (f) Quantification of the loss of fluorescence in e by flow cytometry of wild-type microglia left untreated or treated with Aβ (1, 3 or 10 µM). Numbers in plots indicate percent cells negative for fluorescence. Data are representative of experiments done three times with similar results (error bars (a,d), s.e.m.).
Figure 4
Figure 4
Lysosomal damage triggers the release of cathepsin B, which is involved in the IL-1β pathway. (a) Confocal microscopy of microglial cells left unstimulated or stimulated for 1 or 4 h with FITC-labeled Aβ (green), and then stained with anti–cathepsin B (red) or anti-LAMP-1 (cyan; far right); nuclei were stained with Hoechst 33258 (blue). Arrows indicate colocalization of cathepsin B and Aβ. Scale bars, 5 µm. (b) Effect of various concentrations (0, 5 or 10 µM) of inhibitors of cathepsin D (CathD inh), cathepsin L (CathL inh) or cathepsin B (CathB inh) on the Aβ-induced release of IL-1β from LPS-primed immortalized microglia (left) and the effect of cathepsin inhibitors at the highest concentration (10 µM) on IL-1β release induced by ATP (right). (c) ELISA of the release of IL-1β by wild-type and cathepsin B–deficient primary macrophages left unstimulated or after stimulation with Aβ, ATP or poly(dA:dT). (d) Caspase-1 activation in microglial cells after stimulation with Aβ (above) or ATP (below) and treatment with the cathepsin B inhibitor (20 µM), assessed by flow cytometry with a fluorescent cell-permeable probe that binds only to activated caspase-1. MFI, mean fluorescence intensity. Data are representative of two (a,c) or three (b,d) separate experiments (error bars (bd), s.e.m.).
Figure 5
Figure 5
Aβ-induced expression of proinflammatory and chemotactic factors is mediated by caspase-1 activation in microglia. (a) Aβ-induced production of nitric oxide (NO) by immortalized microglia after 1 h of pretreatment with the caspase-1-specific inhibitor z-YVAD-fmk. (b) Production of nitric oxide by immortalized wild-type and caspase-1-deficient cells after stimulation for 24 h with Aβ, revAβ or zymosan (10 µg/ml) or without stimulation. (c,d) ELISA of TNF production by the cells in a (c) or b (d). (e) Production of nitric oxide by immortalized wild-type, ASC-, NALP3- or Ipaf-deficient macrophages left unstimulated or stimulated for 24 h with revAβ (10 µM), Aβ (10 µM) or LPS (100 ng/ml). (f) Confocal microscopy of CAD mouse neuronal cells cultured with microglia from wild-type and caspase-1-deficient mice, then stimulated with Aβ (10 µM, 72 h), and then fixed and stained with antibodies specific for neurons (TUJ-1; green) and microglia (CD11b; red); nuclei were stained with Hoechst 33258 (blue). Scale bar, 50 µm. (g) Real-time quantitative PCR of CCL3, CCL4 and CXCL2 mRNA in primed, immortalized wild-type and caspase-1-deficient microglia stimulated for 0, 6 or 24 h with Aβ, presented as ‘fold induction’ relative to that of unstimulated cells. Data are representative of experiments done three times with nearly identical results (ae), experiments done twice (f) or experiments done three times (g; error bars (ae,g), s.e.m.).
Figure 6
Figure 6
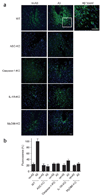
IL-1-mediated pathways contribute to microglial activation induced by Aβ in vivo. (a) Confocal microscopy of coronal brain sections from wild-type mice and mice deficient in ASC, caspase-1, IL-1R or MyD88 at 48 h after stereotactical microinjection of Aβ (1 µg) into the striatum and revAβ into the contralateral hemisphere (control); sections are stained with anti-F4/80 (green) and nuclei are stained with Hoechst 33258 (blue). Scale bars, 50 µm. (b) Quantification of the fluorescence intensity of the F4/80 staining in a to assess recruited microglia and mononuclear phagocytes, normalized to that of wild-type mice treated with Aβ (set as 100%) and presented as the mean and s.e.m. of each group (n = 4 mice per group, with five consecutive sections quantified for each mouse). Data are representative of experiments done twice with each mouse.

Comment in

Similar articles

Cited by

References

    1. Weiner HL, Frenkel D. Immunology and immunotherapy of Alzheimer’s disease. Nat. Rev. Immunol. 2006;6:404–416. - PubMed
    1. Meyer-Luehmann M, et al. Rapid appearance and local toxicity of amyloid-β plaques in a mouse model of Alzheimer’s disease. Nature. 2008;451:720–724. - PMC - PubMed
    1. Simard AR, Soulet D, Gowing G, Julien JP, Rivest S. Bone marrow-derived microglia play a critical role in restricting senile plaque formation in Alzheimer’s disease. Neuron. 2006;49:489–502. - PubMed
    1. Itagaki S, McGeer PL, Akiyama H, Zhu S, Selkoe D. Relationship of microglia and astrocytes to amyloid deposits of Alzheimer disease. J. Neuroimmunol. 1989;24:173–182. - PubMed
    1. Weggen S, et al. A subset of NSAIDs lower amyloidogenic Aβ42 independently of cyclooxygenase activity. Nature. 2001;414:212–216. - PubMed

Publication types

MeSH terms

Substances