Cooperative regulation of chondrocyte differentiation by CCN2 and CCN3 shown by a comprehensive analysis of the CCN family proteins in cartilage
- PMID: 18597638
- PMCID: PMC6956620
- DOI: 10.1359/jbmr.080615
Cooperative regulation of chondrocyte differentiation by CCN2 and CCN3 shown by a comprehensive analysis of the CCN family proteins in cartilage
Abstract
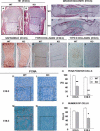
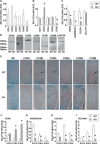
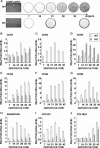
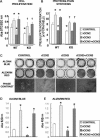
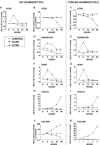
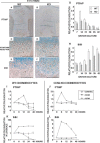
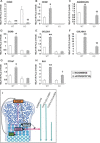
CCN2 is best known as a promoter of chondrocyte differentiation among the CCN family members, and its null mice display skeletal dysmorphisms. However, little is known concerning roles of the other CCN members in chondrocytes. Using both in vivo and in vitro approaches, we conducted a comparative analysis of CCN2-null and wildtype mice to study the roles of CCN2 and the other CCN proteins in cartilage development. Immunohistochemistry was used to evaluate the localization of CCN proteins and other chondrocyte-associated molecules in the two types of mice. Moreover, gene expression levels and the effects of exogenous CCN proteins on chondrocyte proliferation, differentiation, and the expression of chondrocyte-associated genes in their primary chondrocytes were evaluated. Ccn3 was dramatically upregulated in CCN2-null cartilage and chondrocytes. This upregulation was associated with diminished cell proliferation and delayed differentiation. Consistent with the in vivo findings, CCN2 deletion entirely retarded chondrocyte terminal differentiation and decreased the expression of several chondrocyte-associated genes in vitro, whereas Ccn3 expression drastically increased. In contrast, the addition of exogenous CCN2 promoted differentiation strongly and induced the expression of the associated genes, whereas decreasing the Ccn3 expression. These findings collectively indicate that CCN2 induces chondrocyte differentiation by regulating the expression of chondrocyte-associated genes but that these effects are counteracted by CCN3. The lack of CCN2 caused upregulation of CCN3 in CCN2-null mice, which resulted in the observed phenotypes, such as the resultant delay of terminal differentiation. The involvement of the PTHrP-Ihh loop in the regulation of CCN3 expression is also suggested.
Figures
Similar articles
-
Cartilage-specific over-expression of CCN family member 2/connective tissue growth factor (CCN2/CTGF) stimulates insulin-like growth factor expression and bone growth.PLoS One. 2013;8(3):e59226. doi: 10.1371/journal.pone.0059226. Epub 2013 Mar 28. PLoS One. 2013. PMID: 23555635 Free PMC article.
-
CCN family 2/connective tissue growth factor (CCN2/CTGF) stimulates proliferation and differentiation of auricular chondrocytes.Osteoarthritis Cartilage. 2008 Jul;16(7):787-95. doi: 10.1016/j.joca.2007.11.001. Epub 2008 Mar 4. Osteoarthritis Cartilage. 2008. PMID: 18289887
-
Roles of heterotypic CCN2/CTGF-CCN3/NOV and homotypic CCN2-CCN2 interactions in expression of the differentiated phenotype of chondrocytes.FEBS J. 2012 Oct;279(19):3584-3597. doi: 10.1111/j.1742-4658.2012.08717.x. Epub 2012 Aug 28. FEBS J. 2012. PMID: 22812570
-
Molecular and Genetic Interactions between CCN2 and CCN3 behind Their Yin-Yang Collaboration.Int J Mol Sci. 2022 May 24;23(11):5887. doi: 10.3390/ijms23115887. Int J Mol Sci. 2022. PMID: 35682564 Free PMC article. Review.
-
[CCN family genes in the development and differentiation of cartilage tissues].Clin Calcium. 2006 Mar;16(3):486-92. Clin Calcium. 2006. PMID: 16508133 Review. Japanese.
Cited by
-
CCN3 modulates bone turnover and is a novel regulator of skeletal metastasis.J Cell Commun Signal. 2012 Jun;6(2):73-85. doi: 10.1007/s12079-012-0161-7. Epub 2012 Mar 18. J Cell Commun Signal. 2012. PMID: 22427255 Free PMC article.
-
WNT1-induced Secreted Protein-1 (WISP1), a Novel Regulator of Bone Turnover and Wnt Signaling.J Biol Chem. 2015 May 29;290(22):14004-18. doi: 10.1074/jbc.M114.628818. Epub 2015 Apr 11. J Biol Chem. 2015. PMID: 25864198 Free PMC article.
-
Molecular regulation of CCN2 in the intervertebral disc: lessons learned from other connective tissues.Matrix Biol. 2013 Aug 8;32(6):298-306. doi: 10.1016/j.matbio.2013.03.006. Epub 2013 Apr 6. Matrix Biol. 2013. PMID: 23567513 Free PMC article. Review.
-
The concept of the CCN protein family revisited: a centralized coordination network.J Cell Commun Signal. 2018 Mar;12(1):3-12. doi: 10.1007/s12079-018-0455-5. Epub 2018 Feb 22. J Cell Commun Signal. 2018. PMID: 29470822 Free PMC article. Review.
-
The role of CCN family genes in haematological malignancies.J Cell Commun Signal. 2015 Sep;9(3):267-78. doi: 10.1007/s12079-015-0296-4. Epub 2015 May 31. J Cell Commun Signal. 2015. PMID: 26026820 Free PMC article.
References
-
- Erlebacher A, Filvaroff EH, Gitelman SE, Derynck R 1995. Toward a molecular understanding of skeletal development. Cell 80: 371–378. - PubMed
-
- Takigawa M, Takano T, Suzuki F 1981. Effects of parathyroid hormone and cyclic AMP analogues on the activity of ornithine decarboxylase and expression of the differentiated phenotype of chondrocytes in culture. J Cell Physiol 106: 259–268. - PubMed
-
- Lanske B, Karaplis AC, Lee K, Luz A, Vortkamp A, Pirro A, Karperien M, Defize LH, Ho C, Mulligan RC, Abou‐Samra AB, Juppner H, Segre GV, Kronenberg HM 1996. PTH/PTHrP receptor in early development and Indian hedgehog‐regulated bone growth. Science 273: 663–666. - PubMed
-
- Kobayashi T, Chung UI, Schipani E, Starbuck M, Karsenty G, Katagiri T, Goad DL, Lanske B, Kronenberg HM 2002. PTHrP and Indian hedgehog control differentiation of growth plate chondrocytes at multiple steps. Development 129: 2977–2986. - PubMed
-
- Yoon BS, Lyons KM 2004. Multiple functions of BMPs in chondrogenesis. J Cell Biochem 93: 93–103. - PubMed
Publication types
MeSH terms
Substances
Grants and funding
LinkOut - more resources
Full Text Sources
Molecular Biology Databases
Research Materials
Miscellaneous

