Clinical Trial
. 2008 Jul 7;205(7):1701-14.
doi: 10.1084/jem.20071681. Epub 2008 Jun 23.

Administration of rhIL-7 in humans increases in vivo TCR repertoire diversity by preferential expansion of naive T cell subsets

Affiliations
Clinical Trial

Administration of rhIL-7 in humans increases in vivo TCR repertoire diversity by preferential expansion of naive T cell subsets

Claude Sportès et al. J Exp Med. .

Abstract

Interleukin-7 (IL-7) is a homeostatic cytokine for resting T cells with increasing serum and tissue levels during T cell depletion. In preclinical studies, IL-7 therapy exerts marked stimulating effects on T cell immune reconstitution in mice and primates. First-in-human clinical studies of recombinant human IL-7 (rhIL-7) provided the opportunity to investigate the effects of IL-7 therapy on lymphocytes in vivo. rhIL-7 induced in vivo T cell cycling, bcl-2 up-regulation, and a sustained increase in peripheral blood CD4(+) and CD8(+) T cells. This T cell expansion caused a significant broadening of circulating T cell receptor (TCR) repertoire diversity independent of the subjects' age as naive T cells, including recent thymic emigrants (RTEs), expanded preferentially, whereas the proportions of regulatory T (T reg) cells and senescent CD8(+) effectors diminished. The resulting composition of the circulating T cell pool more closely resembled that seen earlier in life. This profile, distinctive among cytokines under clinical development, suggests that rhIL-7 therapy could enhance and broaden immune responses, particularly in individuals with limited naive T cells and diminished TCR repertoire diversity, as occurs after physiological (age), pathological (human immunodeficiency virus), or iatrogenic (chemotherapy) lymphocyte depletion.


Figures
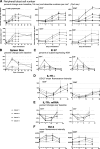
Figure 1.
Figure 1.
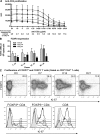
Effects of rhIL-7 therapy on circulating T cells and spleen. rhIL-7 was administered every other day on day 1–14 (8 injections, indicated by tick marks on X axis), at 4 dose levels: 3 μg/kg/d (dashed line with •; n = 3); 10 μg/kg/d (dotted line with △; n = 3); 30 μg/kg/d (dashed line with □; n = 5); and 60 μg/kg/d (solid line with ○; n = 4). Mean value for each cohort (± the SEM) are plotted at the indicated time points. (A) The absolute lymphocyte count from complete blood counts (left) and flow cytometry–based frequency were used to determine circulating absolute CD3+/CD4+ and CD3+/CD8+ counts, absolute numbers ± the SEM (bottom graphs), and percent change in absolute numbers over baseline (top graphs) of the respective subsets shown on day 1 (total lymphocytes only), 7, 14, 21, and 28 for all treated subjects, as well as day 55–90 for subjects treated with 30 or 60 μg/kg/d. Baseline values represent the mean of four separate analyses performed in each subject within 2 wk before initiation of rhIL-7 therapy. (B) Spleen size: bidimensional product by CT scan obtained at the time points shown; percent changes from the pretherapy scan are plotted. (C–F) Baseline (1 value obtained on day 0) and day 7, 14, 21, and 28 data points were generated for CD3+/CD4+ (left) and CD3+/CD8+ subsets (right). (C) Ki-67 shows the percentage of cells in the respective subsets expressing Ki-67 via flow cytometry at the time points shown. (D) IL-7Rα expression as MFI via flow cytometry for each subset. (E) IL-7Rα mRNA expression represented as mean percent change from baseline of IL-7-Rα mRNA copies normalized/104 copies of AXTB via Q-PCR in sorted CD4+ and CD8+ cells. (F) bcl-2 expression as MFI (after subtracting background staining for each subset) via flow cytometry for each subset.
Figure 2.
Figure 2.
PET-CT imaging of the self-limited lymphoid organs' enlargement and increased metabolic activity after rhIL-7 therapy. Shown are representative images on PET-CT scan in one subject (42-yr-old female treated with 60 μg/kg/dose). (left) Imaging on day 14 (last day of rhIL-7 treatment). (right) Day 56 (6 wk after the end of treatment). The full ovals indicate areas of increased size (except for vertebral bodies) and activity of lymphoid organs (left and right axillary adenopathy, spleen, and lumbar spine) at the end of treatment. The dotted contours indicate the thymic area where no increased activity can be demonstrated at day 14. Increased metabolic activity is seen in pink and maximal in yellow areas.
Figure 3.
Figure 3.
rhIL-7–expanded T cells show robust proliferative responses to CD3 signaling and are not enriched for FOXP3 expressing cells.(A) PBMCs were collected at the time points shown, cryopreserved, and then thawed before analysis. Proliferation in response to titrated doses of plate-bound anti-CD3 was measured by 3H incorporation, as described in the Materials and methods. Similar increases in CD3-induced proliferation were observed across dose levels, therefore results for all dose levels are pooled (n = 15) and compared with normal donors run simultaneously (solid line with ▪, n = 16). rhIL-7–treated subjects showed increased proliferative responses to anti-CD3 on day 7 (dotted line with ▾), day 14 (dashed line with ♦), and day 21 (dashed line with •) compared with normal donors and on day 7 and 14 compared with baseline values (dashed and dotted line with filled ▴; P < 0.05, two-tailed Mann-Whitney test). (B) FOXP3 mRNA copies per 104AXTB mRNA were quantified from sorted CD3+/CD4+ cells as detailed in the Materials and methods. No significant change in FOXP3 mRNA was detected between baseline values (white) and values obtained at the time of CD4+ expansion (day 14 in gray and day 21 in black; P = NS). Mean ± the SEM of data from subjects enrolled at each dose level are shown: 3 μg/kg (n = 2), 10 μg/kg (n = 3), 30 μg/kg (n = 4), and 60 μg/kg (n = 5). (C) Two-dimensional plots (top) and overlay histograms (bottom) of Ki67 expression in T reg cells and other CD4+ and CD8+ T cells in an individual subject. Percent Ki-67+ cells are indicated in each frame. Pretreatment, shaded histograms; day 7, black; day 14, dark gray; day 21, light gray.
Figure 4.
Figure 4.
rhIL-7 therapy increases TCR repertoire diversity by Vβ family spectratype analysis. (A) Schematic representation of the methodology. Vβ family spectratype analysis was performed for each of 6 subjects (3 of each cohort 3 and 4), separately on CD4+ and CD8+ cells by RT-PCR on RNA extracted from sorted T cells at baseline and at D21. The distributions of peaks for each Vβ family are graphically represented on a curve. (B) Schematic of divergence score calculation. Divergence from the normal donor standard was calculated for each Vβ family, separately for CD4+ and CD8+ cells, for each individual, at baseline and at day 21. Two Vβ families (Vβ14 on the left and Vβ23 on the right) are illustrated for the sorted CD8+ population in one individual (Pt 11), pre (rows 1 and 3), and post (rows 2 and 4) therapy. Overlays of histograms for the subject (no color) and the normal donor standard (in gray) illustrate how the divergence scores were calculated (see Materials and methods). (C)Divergence scores for CD8+ cells in one subject. Divergence scores are shown at baseline (pre) and day 21 (post) for each Vβ family, and a diversity shift was obtained (Pre-Post). The median diversity shift (a positive value indicates a shift toward greater repertoire diversity) and the P value of Wilcoxon pair test comparing the pre and post divergence scores are shown, and then incorporated into the summary in D. (D) Summary of repertoire diversity analysis. for each tested individual (age), shown at baseline (D0) and D21 are as follows: the total naive CD4+ and naive CD8+ cells counts; the median diversity shift for each CD4 and CD8 subsets of each individual and the P values of the Wilcoxon pair test indicating the likelihood that the calculated change in divergence scores for a particular subject's CD4+ or CD8+ cells between day 21 and baseline occurred by chance; P values <0.05 indicate a statistically significant increase in diversity toward normality between baseline and day 21 studies.
Figure 5.
Figure 5.
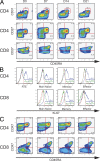
rhIL-7 therapy induces cycling of most T cell subsets, but preferentially expands naive CD4+ and CD8+ cells and CD4+ central memory cells. Representative data from a single subject treated at 60 μg/kg/d are shown. (A) Two-dimensional plots illustrating the rhIL-7 therapy–induced increased frequency of CD4+ RTEs (CD31+/CD45RA+; red boxes in first row of graphs), and changes in CD4+ and CD8+ naive, memory, and effector subsets (respectively CD45RA+/CD27+, CD45RA/CD27+, and CD45RA/CD27 sections on second and third rows). (B) Overlay histograms of Ki-67 expression on CD4+ RTEs (CD31+/CD45RA+) and CD4+ and CD8+ naive (CD45RA+/CD27+), memory (CD45RA/CD27+), and effector (CD45RA/CD27) subsets. Percent Ki-67+ cells are indicated in each frame. Red lines, pretreatment; blue lines, day 7; green lines, day 14; orange lines, day 21. Note that at the end of treatment (green line), the percentage of Ki67+ memory and effector CD8+ populations drop to lower levels than the naive CD8+. (C) Two-dimensional plots illustrating the rhIL-7 therapy–induced changes in CD4+ (top row) and CD8+ (bottom row) naive, central memory, effector memory, and effectors (respectively CD45RA+/CCR7+, CD45RA/CCR7+, CD45RA/CCR7, and CD45RA+/−/CCR7 sections).
Figure 6.
Figure 6.
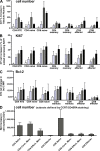
rhIL-7 induces cycling and increases bcl-2 expression across subsets, but preferentially expands naive T cells and CD4+ memory cells. Changes in cell number (A), Ki-67 expression (B), and bcl-2 expression (C) are shown for subjects treated at 3 μg/kg/d (white), 10 μg/kg/d (speckled), 30 μg/kg/d (gray), and 60 μg/kg/d (black). The time points shown represent the point of maximal increase for each parameter, as illustrated in Fig. 1, as follows: day 21 for increase in cell number, day 7 for Ki-67, and day 14 for bcl-2 expression. (A) Percent increase in absolute circulating cell number (per milliliter) over pretherapy value for each subset at day 21 after rhIL-7. Percent increase in the naive CD8+ subset were significantly higher than for the CD8+ memory (P = 0.008) or CD8+ effector subsets (P = 0.008). (B) Net increase in the proportion of Ki67+ cells in each subset at day 7 was calculated by subtracting the percentage of each subset that expressed Ki-67 at baseline from the percentage expressing Ki-67 at day 7 of rhIL-7 therapy. (C) Net increase in bcl-2 MFI in each subset at day 14 was calculated by subtracting the MFI of bcl-2 expression at baseline from the MFI on day 14 after rhIL-7 for each subset. See Fig. S2 for detailed data on changes in subset parameters for each dose level. (D) Net increase in cell number at day 21 in subsets defined by CCR7 and CD45RA surface expression (see Materials and methods) as follows: naive (CCR7+CD45RA+), central memory (CCR7+CD45RA), effector memory (CCR7CD45RA), and effector RA (CCR7CD45RA+). Mean value for the six studied subjects. Error bars represent the SEM. Fig S2 is available at http://www.jem.org/cgi/content/full/jem.20071681/DC1.
Figure 7.
Figure 7.
rhIL-7 therapy increases the number of TREC-expressing cells in the peripheral blood. We measured TRECs in sorted CD4+ and CD8+ T cells at the time points shown, and values shown were normalized per 105 cells. Individual subjects (♦); mean of cohort (± the SEM): 3 μg/kg/d (dashed line with •), 10 μg/kg/d (dotted line with △), 30 μg/kg/d (dashed line with □), 60 μg/kg/d (solid line with ○). Tick marks represent rhIL-7 injections. (A) Absolute number of circulating TRECs/mm3 of blood diminished during the first 7 d of rhIL-7 therapy, consistent with a decrease in naive populations during this period. Rises in TRECs were observed from day 7–28, consistent with increased numbers of enumerated phenotypically naive cells during this period. (B) No significant changes in the frequency of TRECs/105 sorted total CD4+ or CD8+ cells was observed, despite increases in cell cycling shown in Figs. 1 and 6 (see text for TRECs in naive subsets).

Similar articles

Cited by

References

    1. Blattman, J.N., J.M. Grayson, E.J. Wherry, S.M. Kaech, K.A. Smith, and R. Ahmed. 2003. Therapeutic use of IL-2 to enhance antiviral T cell responses in vivo. Nat. Med. 9:540–547. - PubMed
    1. Khan, I.A., and L. Casciotti. 1999. IL-15 prolongs the duration of CD8+ T cell-mediated immunity in mice infected with a vaccine strain of Toxoplasma gondii. J. Immunol. 163:4503–4509. - PubMed
    1. Berzofsky, J.A., J.D. Ahlers, J. Janik, J. Morris, S. Oh, M. Terabe, and I.M. Belyakov. 2004. Progress on new vaccine strategies against chronic viral infections. J. Clin. Invest. 114:450–462. - PMC - PubMed
    1. Wang, L.X., R. Li, G. Yang, M. Lim, A. O'Hara, Y. Chu, B.A. Fox, N.P. Restifo, W.J. Urba, and H.M. Hu. 2005. Interleukin-7-dependent expansion and persistence of melanoma-specific T cells in lymphodepleted mice lead to tumor regression and editing. Cancer Res. 65:10569–10577. - PMC - PubMed
    1. Zeng, R., R. Spolski, S.E. Finkelstein, S. Oh, P.E. Kovanen, C.S. Hinrichs, C.A. Pise-Masison, M.F. Radonovich, J.N. Brady, N.P. Restifo, et al. 2005. Synergy of IL-21 and IL-15 in regulating CD8+ T cell expansion and function. J. Exp. Med. 201:139–148. - PMC - PubMed

Publication types

MeSH terms