Global impact of oncogenic Src on a phosphotyrosine proteome
- PMID: 18563927
- PMCID: PMC2579752
- DOI: 10.1021/pr800187n
Global impact of oncogenic Src on a phosphotyrosine proteome
Abstract
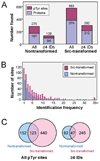
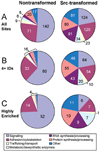
Elevated activity of Src, the first characterized protein-tyrosine kinase, is associated with progression of many human cancers, and Src has attracted interest as a therapeutic target. Src is known to act in various receptor signaling systems to impact cell behavior, yet it remains likely that the spectrum of Src protein substrates relevant to cancer is incompletely understood. To better understand the cellular impact of deregulated Src kinase activity, we extensively applied a mass spectrometry shotgun phosphotyrosine (pTyr) proteomics strategy to obtain global pTyr profiles of Src-transformed mouse fibroblasts as well as their nontransformed counterparts. A total of 867 peptides representing 563 distinct pTyr sites on 374 different proteins were identified from the Src-transformed cells, while 514 peptides representing 275 pTyr sites on 167 proteins were identified from nontransformed cells. Distinct characteristics of the two profiles were revealed by spectral counting, indicative of pTyr site relative abundance, and by complementary quantitative analysis using stable isotope labeling with amino acids in cell culture (SILAC). While both pTyr profiles are replete with sites on signaling and adhesion/cytoskeletal regulatory proteins, the Src-transformed profile is more diverse with enrichment in sites on metabolic enzymes and RNA and protein synthesis and processing machinery. Forty-three pTyr sites (32 proteins) are predicted as major biologically relevant Src targets on the basis of frequent identification in both cell populations. This select group, of particular interest as diagnostic biomarkers, includes well-established Src sites on signaling/adhesion/cytoskeletal proteins, but also uncharacterized sites of potential relevance to the transformed cell phenotype.
Figures


Comment in
-
An enriching phosphotyrosine experience for Src substrates.J Proteome Res. 2008 Aug;7(8):3066. doi: 10.1021/pr8004474. J Proteome Res. 2008. PMID: 18671371 No abstract available.
Similar articles
-
An enriching phosphotyrosine experience for Src substrates.J Proteome Res. 2008 Aug;7(8):3066. doi: 10.1021/pr8004474. J Proteome Res. 2008. PMID: 18671371 No abstract available.
-
Tandem Mass Tag Approach Utilizing Pervanadate BOOST Channels Delivers Deeper Quantitative Characterization of the Tyrosine Phosphoproteome.Mol Cell Proteomics. 2020 Apr;19(4):730-743. doi: 10.1074/mcp.TIR119.001865. Epub 2020 Feb 18. Mol Cell Proteomics. 2020. PMID: 32071147 Free PMC article.
-
Photoaffinity-engineered protein scaffold for systematically exploring native phosphotyrosine signaling complexes in tumor samples.Proc Natl Acad Sci U S A. 2018 Sep 18;115(38):E8863-E8872. doi: 10.1073/pnas.1805633115. Epub 2018 Sep 6. Proc Natl Acad Sci U S A. 2018. PMID: 30190427 Free PMC article.
-
Src kinase regulation by phosphorylation and dephosphorylation.Biochem Biophys Res Commun. 2005 May 27;331(1):1-14. doi: 10.1016/j.bbrc.2005.03.012. Biochem Biophys Res Commun. 2005. PMID: 15845350 Review.
-
[Analysis of oncogenic signaling induced by tyrosine kinases in tumors by SILAC-based quantitative proteomic approach].Med Sci (Paris). 2014 May;30(5):558-66. doi: 10.1051/medsci/20143005020. Epub 2014 Jun 13. Med Sci (Paris). 2014. PMID: 24939544 Review. French.
Cited by
-
DOC2b Enhances β-Cell Function via a Novel Tyrosine Phosphorylation-Dependent Mechanism.Diabetes. 2022 Jun 1;71(6):1246-1260. doi: 10.2337/db21-0681. Diabetes. 2022. PMID: 35377441 Free PMC article.
-
Stable-isotope dilution LC–MS for quantitative biomarker analysis.Bioanalysis. 2010 Feb;2(2):311-41. doi: 10.4155/bio.09.185. Bioanalysis. 2010. PMID: 20352077 Free PMC article. Review.
-
Rewiring kinase specificity with a synthetic adaptor protein.J Am Chem Soc. 2012 Mar 7;134(9):3976-8. doi: 10.1021/ja211089v. Epub 2012 Feb 22. J Am Chem Soc. 2012. PMID: 22352870 Free PMC article.
-
Mass spectrometric analysis identifies a cortactin-RCC2/TD60 interaction in mitotic cells.J Proteomics. 2012 Apr 3;75(7):2153-9. doi: 10.1016/j.jprot.2012.01.012. Epub 2012 Jan 17. J Proteomics. 2012. PMID: 22282019 Free PMC article.
-
Sorting nexin 9 negatively regulates invadopodia formation and function in cancer cells.J Cell Sci. 2016 Jul 15;129(14):2804-16. doi: 10.1242/jcs.188045. Epub 2016 Jun 8. J Cell Sci. 2016. PMID: 27278018 Free PMC article.
References
-
- Jove R, Hanafusa H. Cell transformation by the viral src oncogene. Ann. Rev. Cell Biol. 1987;3:31–56. - PubMed
-
- Frame MC. Newest findings on the oldest oncogene; how activated src does it. J. Cell Sci. 2004;117:989–998. - PubMed
-
- Summy JM, Gallick GE. Src family kinases in tumor progression and metastasis. Cancer Metastasis Rev. 2003;22:337–358. - PubMed
-
- Yeatman TJ. A renaissance for SRC. Nat. Rev. Cancer. 2004;4:470–480. - PubMed
Publication types
MeSH terms
Substances
Grants and funding
- R01 GM049882/GM/NIGMS NIH HHS/United States
- P50 CA095103/CA/NCI NIH HHS/United States
- U54 RR020839/RR/NCRR NIH HHS/United States
- R01 CA106424-04/CA/NCI NIH HHS/United States
- CA 106424/CA/NCI NIH HHS/United States
- P30 CA068485-12/CA/NCI NIH HHS/United States
- R01 CA106424/CA/NCI NIH HHS/United States
- U54 RR 020839/RR/NCRR NIH HHS/United States
- GM 49882/GM/NIGMS NIH HHS/United States
- P30 CA068485/CA/NCI NIH HHS/United States
- CA 68485/CA/NCI NIH HHS/United States
- P50 CA095103-06/CA/NCI NIH HHS/United States
- R01 GM049882-13/GM/NIGMS NIH HHS/United States
- 2 P50 CA 95103/CA/NCI NIH HHS/United States
LinkOut - more resources
Full Text Sources
Other Literature Sources
Molecular Biology Databases
Miscellaneous

