. 2008 Aug 22;283(34):22930-41.
doi: 10.1074/jbc.M801408200. Epub 2008 Jun 14.

Increased cellular free cholesterol in macrophage-specific Abca1 knock-out mice enhances pro-inflammatory response of macrophages

Affiliations

Increased cellular free cholesterol in macrophage-specific Abca1 knock-out mice enhances pro-inflammatory response of macrophages

Xuewei Zhu et al. J Biol Chem. .

Abstract

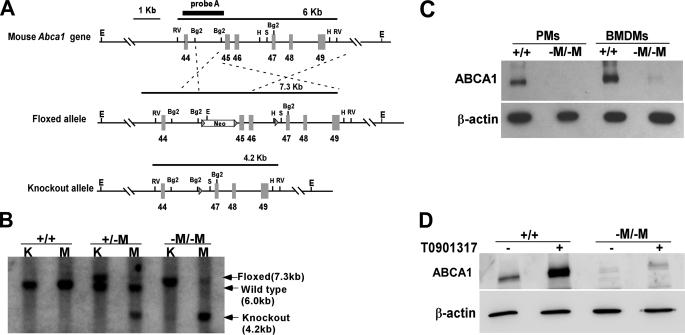
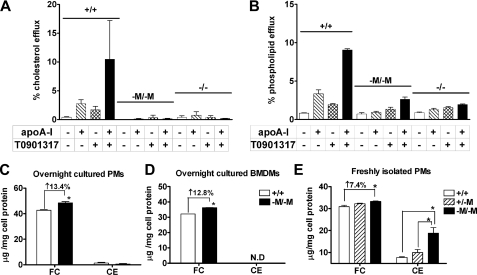
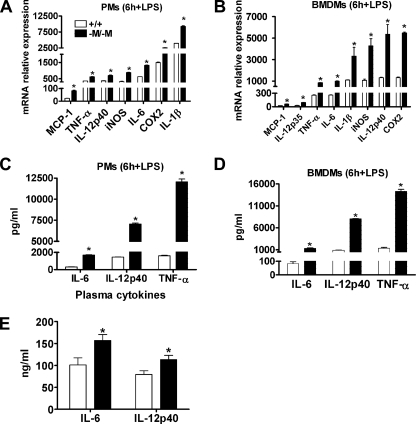
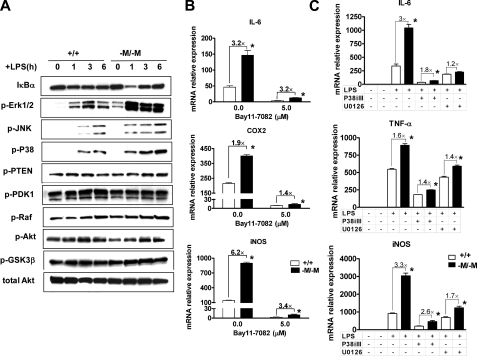
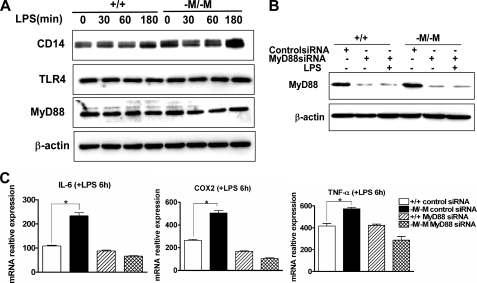
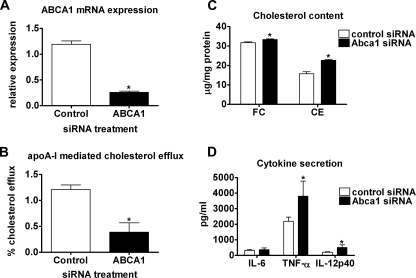
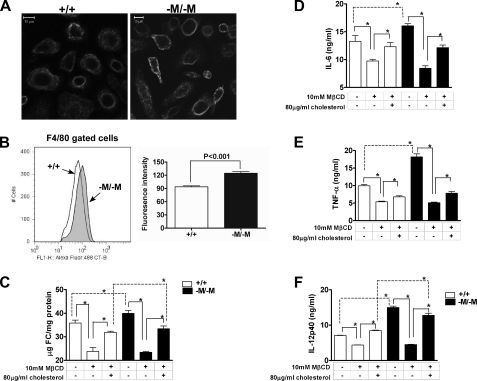
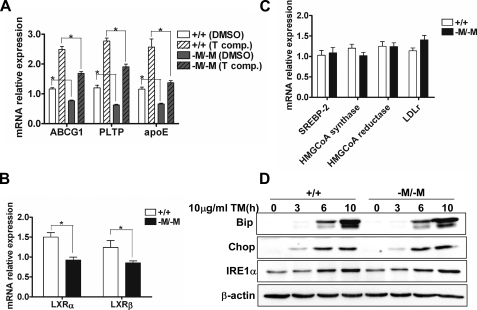
Macrophage-specific Abca1 knock-out (Abca1(-)(M)(/-)(M)) mice were generated to determine the role of macrophage ABCA1 expression in plasma lipoprotein concentrations and the innate immune response of macrophages. Plasma lipid and lipoprotein concentrations in chow-fed Abca1(-)(M)(/-)(M) and wild-type (WT) mice were indistinguishable. Compared with WT macrophages, Abca1(-)(M)(/-)(M) macrophages had a >95% reduction in ABCA1 protein, failed to efflux lipid to apoA-I, and had a significant increase in free cholesterol (FC) and membrane lipid rafts without induction of endoplasmic reticulum stress. Lipopolysaccharide (LPS)-treated Abca1(-)(M)(/-)(M) macrophages exhibited enhanced expression of pro-inflammatory cytokines and increased activation of the NF-kappaB and MAPK pathways, which could be diminished by silencing MyD88 or by chemical inhibition of NF-kappaB or MAPK. In vivo LPS injection also resulted in a higher pro-inflammatory response in Abca1(-)(M)(/-)(M) mice compared with WT mice. Furthermore, cholesterol depletion of macrophages with methyl-beta-cyclodextrin normalized FC content between the two genotypes and their response to LPS; cholesterol repletion of macrophages resulted in increased cellular FC accumulation and enhanced cellular response to LPS. Our results suggest that macrophage ABCA1 expression may protect against atherosclerosis by facilitating the net removal of excess lipid from macrophages and dampening pro-inflammatory MyD88-dependent signaling pathways by reduction of cell membrane FC and lipid raft content.


Figures

FIGURE 1.
FIGURE 1.
Generation of macrophage-specific Abca1 knock-out (Abca1M/–M) mice. A, targeting strategy of Abca1M/–M mice. The schematic of the 3′-region (exons 44–49) of the Abca1 gene shows WT (upper), floxed (middle), and KO (lower) Abca1 alleles. Cre recombinase-mediated deletion of exons 45 and 46 eliminates the second ATP-binding cassette, resulting in a KO allele. E, EcoRI; Rv, EcoRV; Bg2, BglII; H, HindIII; S, SacI. B, Southern blot of genomic kidney (K) and peritoneal macrophage (M) DNAs from mice with WT (+/+) or floxed (–M/–M) alleles in the presence of lysozyme M Cre recombinase. DNA was digested with EcoRV and hybridized with a probe to the genomic region between exons 44 and 45 in the Abca1 gene to produce the 6-kb WT, 7.3-kb floxed, or 4.2-kb KO band. C, Western blot of cell lysates from cultured elicited PMs or BMDMs from WT (+/+) and Abca1M/–M (–M/–M) mice with antibodies against mouse ABCA1 and β-actin (loading control). D, Western blot of cell lysates from cultured thioglycolate-elicited PMs after 18 h of incubation with or without 10 μm T0901317 (LXR agonist).
FIGURE 2.
FIGURE 2.
Decreased lipid efflux and increased cholesterol accumulation in cultured macrophages from Abca1M/–M mice. A and B, thioglycolate-elicited PMs were isolated from WT (+/+), Abca1M/–M (–M/–M), and Abca1 total KO (–/–) mice; radiolabeled with [3H]cholesterol or [14C]choline chloride for 24 h; and then incubated with 10 μm T0901317 or vehicle (Me2SO) for an additional 24 h. Lipid efflux was initiated by incubating macrophages with or without 20 μg/ml apoA-I ± T0901317. Radiolabel in the medium and the cellular isopropyl alcohol extracts were quantified, and percentage efflux was calculated as the ratio of radioactivity in the medium divided by the total radioactivity (cells + medium) × 100%. C–E, after the specified incubation conditions, cells were extracted with isopropyl alcohol containing 5α-cholestane as an internal standard, and free and total cholesterol were quantified by gas-liquid chromatography. CE was calculated as (total – free cholesterol) × 1.67. Cell protein was determined using the Lowry protein assay. C, after 2 h of incubation and removal of non-adherent cells, PMs were cultured in RPMI 1640 medium overnight before cholesterol mass measurement (n = four to five dishes of cells/genotype). D, after 7 days of culture in bone marrow medium, BMDMs were incubated in 1% Nutridoma-SP medium overnight before measurement of cholesterol (n = four to five dishes of cells/genotype). Data are the means ± S.D. (assayed in triplicate). ND, not detectable. E, elicited peritoneal cells were isolated from individual mice (n = 3 for WT and Abca1M/–M and 2 for Abca1+/–M), incubated in 1% Nutridoma-SP medium for 2 h, and washed to remove non-adherent cells before cholesterol measurement (n ≥ four dishes of cells/mouse). *, p < 0.05 compared with +/+.
FIGURE 3.
FIGURE 3.
Abca1M/–M macrophages are hypersensitive to LPS. After overnight culture in 10% FBS containing RPMI 1640 medium, PMs and BMDMs were incubated for 2 h in serum-free medium and then treated with 100 ng/ml LPS for 6 h. Cytokine and chemokine mRNA expression and protein secretion were analyzed by real-time PCR and ELISA, respectively. LPS stimulated higher mRNA (A and B) and protein (C and D) expression of cytokines and chemokines in Abca1M/–M (–M/–M) PMs (A and C) and BMDMs (B and D) relative to WT (+/+) macrophages. Data are the means ± S.D. (assayed in triplicate). Experiments were repeated at least twice. iNOS, inducible nitric-oxide synthase. E, plasma levels of inflammatory cytokines in LPS-injected mice. Mice were given an intraperitoneal injection of pyrogen-free PBS or 3 mg of LPS/kg of body weight and killed 3 h after injection. Plasma cytokine levels were determined using commercially available ELISA kits as described under “Experimental Procedures.” Data are the means ± S.D. for LPS-injected mice (n = four to five mice/genotype). Values for PBS-injected mice were below the detection limits of the assay (16.5 pg/ml). *, p < 0.05 compared with +/+.
FIGURE 4.
FIGURE 4.
NF-κB and MAPK pathways are involved in the hypersensitivity of Abca1M/–M macrophages to LPS. A, BMDMs from WT (+/+) or Abca1M/–M (–M/–M) mice were treated for 0, 1, 3, or 6 h with 100 ng/ml LPS. Cell lysates were harvested, followed by immunoblotting with the indicated antibodies. B, elicited PMs from mice were pretreated for 1 h with the IκBα inhibitor Bay 11-7082 (5.0 μm) before challenge with 100 ng/ml LPS for 6 h. Cellular RNA was then harvested to quantify inflammatory gene expression by quantitative RT-PCR. iNOS, inducible nitric-oxide synthase. C, BMDMs were pretreated for 1 h with 25 μm U0126 (MEK/ERK inhibitor) or 2 μm p38 MAPK inhibitor III (P38iIII) and then treated with 100 ng/ml LPS for 3 h before quantification of inflammatory gene expression by RT-PCR. Data are presented as the means ± S.D. (assayed in triplicate). Experiments were repeated twice. *, p < 0.05 compared with +/+.
FIGURE 5.
FIGURE 5.
Enhanced LPS-stimulated activation of Abca1M/–M macrophages is MyD88-dependent. A, shown are the results from Western blot analysis of CD14, TLR4, and MyD88 protein expression in BMDMs from WT (+/+) and Abca1M/–M (–M/–M) mice after in vitro treatment with 100 ng/ml LPS for 0, 30, 60, and 180 min. B, MyD88 expression was silenced by transfecting elicited PMs from WT or Abca1M/–M mice with the indicated siRNAs for 72 h before challenging the cells with 100 ng/ml LPS for 6 h. Western blotting was performed to determine protein silencing efficiency. C, quantitative RT-PCR was performed to quantify cytokine mRNA expression after MyD88 silencing. Data are presented as the means ± S.D. (assayed in triplicate). *, p < 0.05 compared with +/+.
FIGURE 6.
FIGURE 6.
Acute silencing of Abca1 in WT macrophages results in increased free cholesterol accumulation and pro-inflammatory response to LPS. PMs from WT mice were transfected with 50 nm control or ABCA1 siRNA for 48 h. A, quantitative RT-PCR was performed to quantify ABCA1 mRNA expression in control and ABCA1 siRNA-transfected cells. B, transfected macrophages were radiolabeled with [3H]cholesterol for 24 h and then equilibrated with bovine serum albumin for an additional 2 h. FC efflux was initiated by incubating macrophages with or without 20 μg/ml apoA-I for 8 h. Radiolabel in the medium and the cellular isopropyl alcohol extracts were quantified, and percentage efflux was calculated as the ratio of radioactivity in the medium divided by the total radioactivity (cells + medium) × 100%. C, cellular lipid was extracted with isopropyl alcohol to measure FC and CE content by gas-liquid chromatography (means ± S.D., n = four to five dishes of cells/group). D, macrophages were incubated with or without 100 ng/ml LPS for 8 h, and pro-inflammatory gene expression was measured by ELISA (means ± S.D., n = 4). *, p < 0.05 compared with control siRNA.
FIGURE 7.
FIGURE 7.
Macrophages from Abca1M/–M mice have increased membrane lipid rafts. A, lipid raft staining of elicited PMs was performed with fluorescently labeled CT-B as described under “Experimental Procedures.” Images were captured under a 20× objective using a Zeiss Model 510 laser scanning confocal microscope. Images are representative at least 50 fields of three coverslips/genotype. Scale bars = 10 μm. B, shown are the results from flow cytometric analysis of macrophage lipid rafts. Cells were isolated from peritoneal cavity fluid of mice 4 days after intraperitoneal injection of thioglycolate and were incubated with phycoerythrin-labeled anti-mouse F4/80 antibody and Alexa Fluor 488-labeled CT-B. A representative intensity plot for F4/80-gated cells from both genotypes of mice is shown in the left panel, and the average data (means ± S.D.) from WT (+/+; n = 4) and Abca1M/–M (–M/–M; n = 3) mice are shown in the right panel. C–F, cholesterol depletion and repletion using MβCD abolished and partially restored the hypersensitivity of Abca1M/–M macrophages to LPS, respectively. BMDMs from WT and Abca1M/–M mice were incubated with or without 10 mm MβCD at 37 °C for 30 min to deplete cells of cholesterol. Some dishes of cells were then repleted with cholesterol by incubation with cholesterol-loaded MβCD (80 μg/ml FC solubilized with 1.5 mm MβCD; 1 h at 37 °C). Cells were then harvested for cholesterol analysis by gas-liquid chromatography (C) or incubated with or without LPS (100 ng/ml; 8 h) before measuring cytokine concentration in the medium by ELISA (D–F). *, p < 0.05 for the indicated comparisons.
FIGURE 8.
FIGURE 8.
Free cholesterol accumulation in macrophages from Abca1M/–M mice is not sensed by the ER. A and B, shown is the lower expression of LXR target genes and LXRs in Abca1M/–M (–M/–M) macrophages. Elicited PMs were treated with Me2SO (DMSO; vehicle) or 10 μm T0901317 (T comp.) for 20 h. Cellular RNA was harvested, and RT-PCR was performed to measure expression of LXR-responsive genes (A) and expression of LXRα/β (B). Assays were performed in triplicate, and data were normalized to the level of gene expression in WT (+/+) macrophages treated with vehicle. PLTP, phospholipid transfer protein. C, expression of sterol-sensing genes was unaltered in Abca1M/–M macrophages. Elicited PMs were isolated and cultured overnight and then incubated in serum-free RPMI 1640 medium for 8 h. Gene expression was measured by RT-PCR after RNA isolation. Assays were performed in triplicate, and the data were normalized to the gene expression level in WT macrophages. HMGCoA, 3-hydroxy-3-methylglutaryl-CoA; LDLr, low density lipoprotein receptor. D, ER stress was not enhanced in Abca1M/–M macrophages. Elicited PMs (n = three dishes of cells/genotype) were treated with 10 μg/ml tunicamycin (TM) for 0–10 h. The ER stress proteins were analyzed by Western blotting. *, p < 0.05 for the indicated comparisons.

Similar articles

Cited by

References

    1. Langmann, T., Klucken, J., Reil, M., Liebisch, G., Luciani, M. F., Chimini, G., Kaminski, W. E., and Schmitz, G. (1999) Biochem. Biophys. Res. Commun. 257 29–33 - PubMed
    1. Wellington, C. L., Walker, E. K., Suarez, A., Kwok, A., Bissada, N., Singaraja, R., Yang, Y. Z., Zhang, L.-H., James, E., Wilson, J. E., Francone, O., McManus, B. M., and Hayden, M. R. (2002) Lab. Investig. 82 273–283 - PubMed
    1. Oram, J. F., and Lawn, R. M. (2001) J. Lipid Res. 42 1173–1179 - PubMed
    1. Attie, A. D., Kastelein, J. P. P., and Hayden, M. R. (2001) J. Lipid Res. 42 1717–1726 - PubMed
    1. Bodzioch, M., Orsó, E., Klucken, J., Langmann, T., Böttcher, A., Diederich, W., Drobnik, W., Barlage, S., Buchler, C., Porsch-Ozcurumez, M., Kaminski, W. E., Hahmann, H. W., Oette, K., Rothe, G., Aslanidis, C., Lackner, K. J., and Schmitz, G. (1999) Nat. Genet. 22 347–351 - PubMed

Publication types