

Kinetics of transmembrane transport of small molecules into electropermeabilized cells
- PMID: 18539632
- PMCID: PMC2527253
- DOI: 10.1529/biophysj.108.135541
Kinetics of transmembrane transport of small molecules into electropermeabilized cells
Abstract
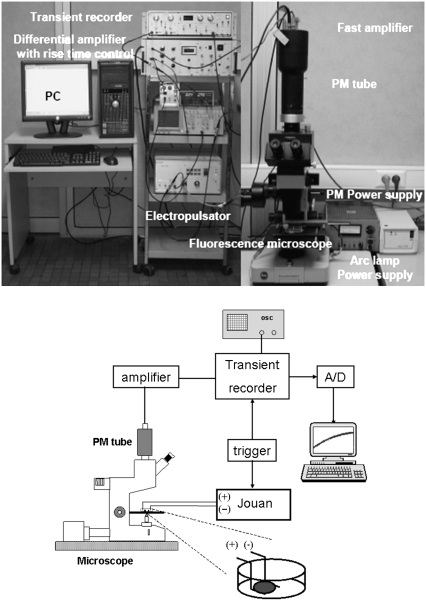
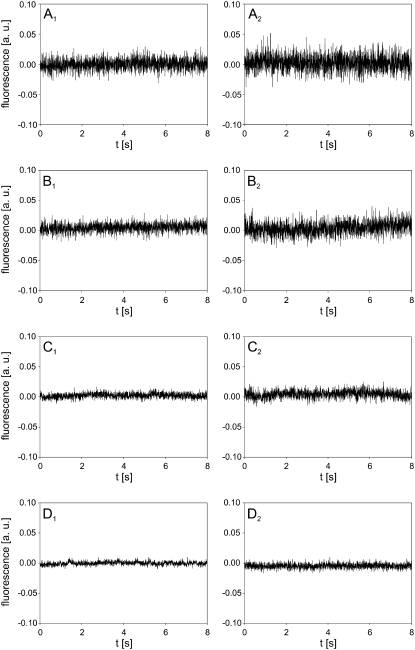
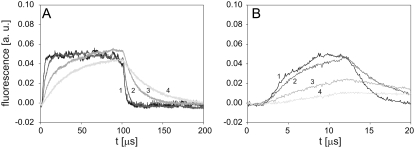
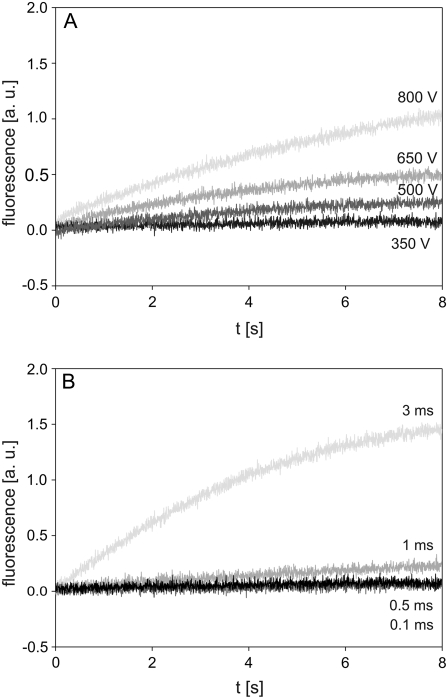
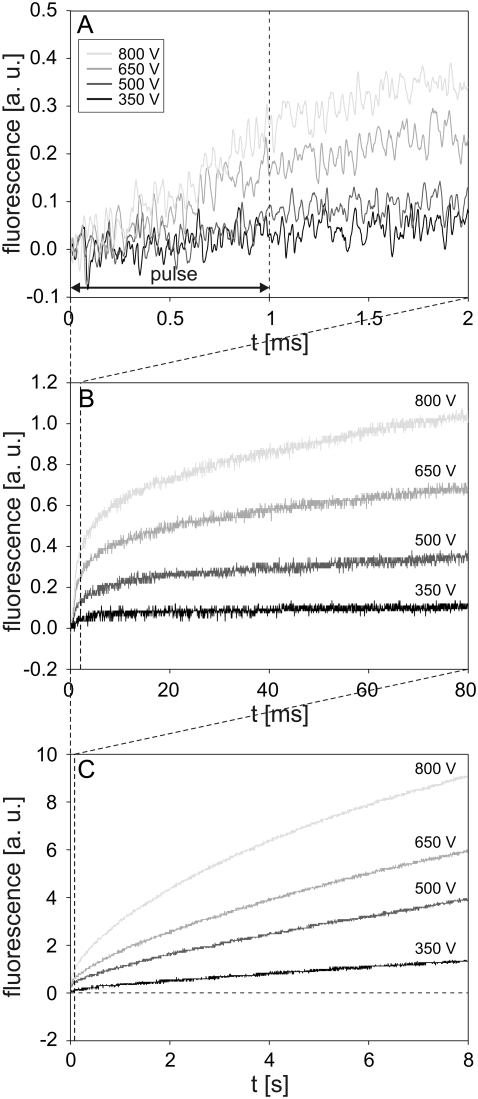
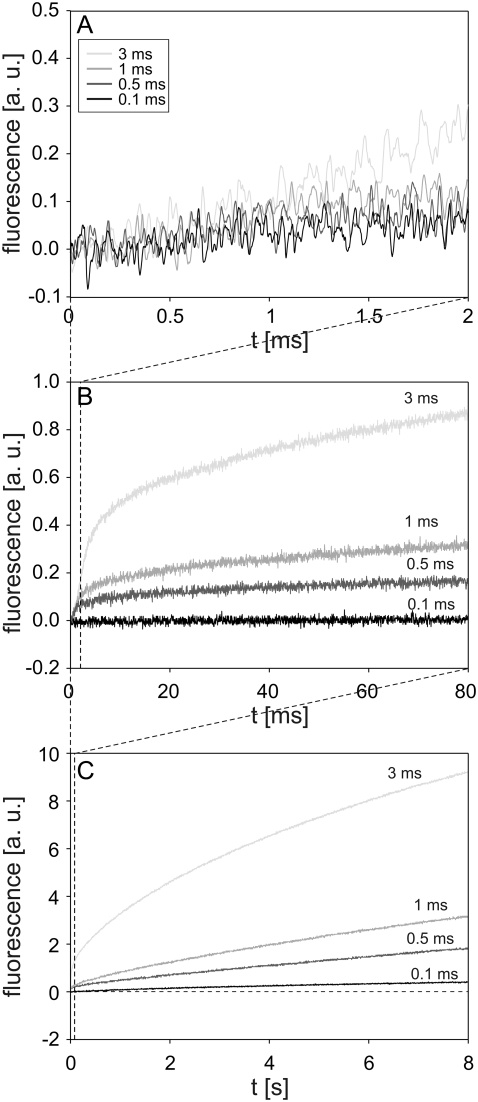
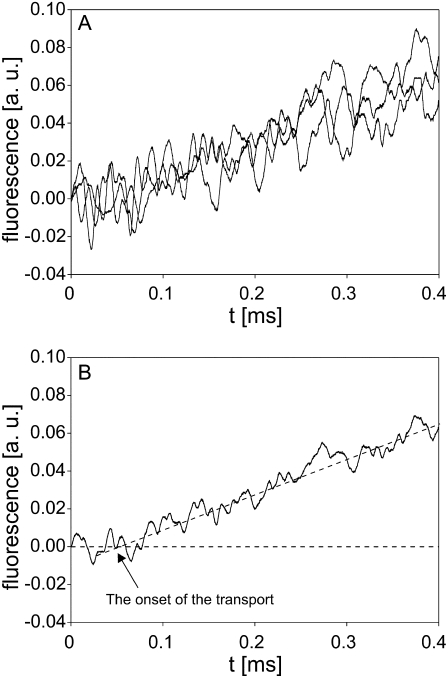
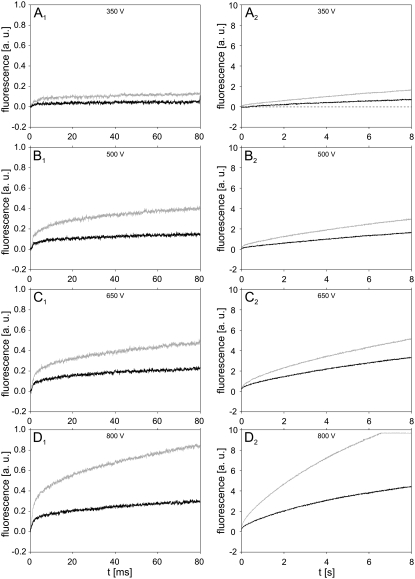
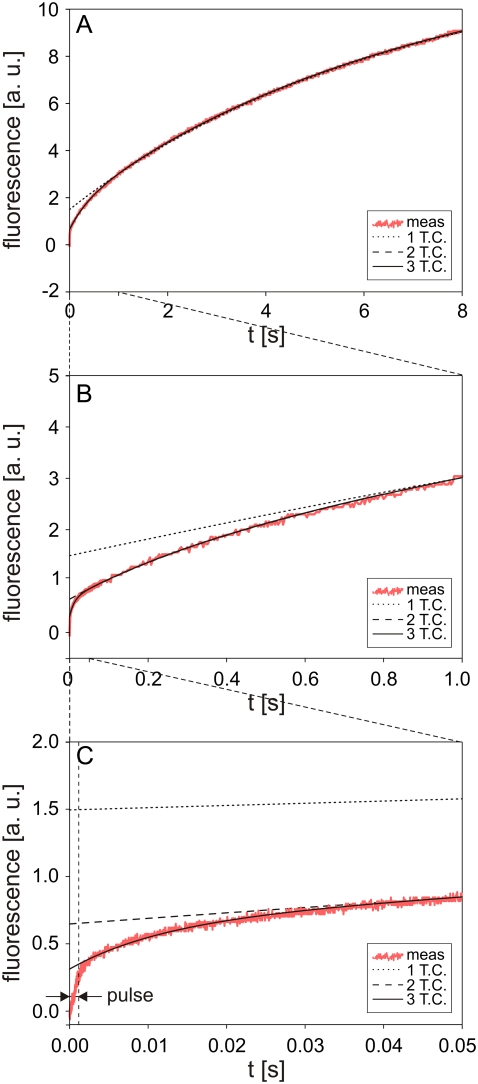
The transport of propidium iodide into electropermeabilized Chinese hamster ovary cells was monitored with a photomultiplier tube during and after the electric pulse. The influence of pulse amplitude and duration on the transport kinetics was investigated with time resolutions from 200 ns to 4 ms in intervals from 400 micros to 8 s. The transport became detectable as early as 60 micros after the start of the pulse, continued for tens of seconds after the pulse, and was faster and larger for higher pulse amplitudes and/or longer pulse durations. With fixed pulse parameters, transport into confluent monolayers of cells was slower than transport into suspended cells. Different time courses of fluorescence increase were observed during and at various times after the pulse, reflecting different transport mechanisms and ongoing membrane resealing. The data were compared to theoretical predictions of the Nernst-Planck equation. After a delay of 60 micros, the time course of fluorescence during the pulse was approximately linear, supporting a mainly electrophoretic solution of the Nernst-Planck equation. The time course after the pulse agreed with diffusional solution of the Nernst-Planck equation if the membrane resealing was assumed to consist of three distinct components, with time constants in the range of tens of microseconds, hundreds of microseconds, and tens of seconds, respectively.
Figures
Similar articles
-
Direct observation in the millisecond time range of fluorescent molecule asymmetrical interaction with the electropermeabilized cell membrane.Biophys J. 1997 Nov;73(5):2630-7. doi: 10.1016/S0006-3495(97)78292-4. Biophys J. 1997. PMID: 9370457 Free PMC article.
-
Transport, resealing, and re-poration dynamics of two-pulse electroporation-mediated molecular delivery.Biochim Biophys Acta. 2015 Aug;1848(8):1706-14. doi: 10.1016/j.bbamem.2015.04.007. Epub 2015 Apr 22. Biochim Biophys Acta. 2015. PMID: 25911207
-
Size of the pores created by an electric pulse: microsecond vs millisecond pulses.Biochim Biophys Acta. 2012 Dec;1818(12):3032-9. doi: 10.1016/j.bbamem.2012.06.018. Epub 2012 Jul 2. Biochim Biophys Acta. 2012. PMID: 22766475
-
Time courses of mammalian cell electropermeabilization observed by millisecond imaging of membrane property changes during the pulse.Biophys J. 1999 Apr;76(4):2158-65. doi: 10.1016/S0006-3495(99)77370-4. Biophys J. 1999. PMID: 10096909 Free PMC article.
-
Quantitative model of small molecules uptake after in vitro cell electropermeabilization.Bioelectrochemistry. 2003 Aug;60(1-2):1-10. doi: 10.1016/s1567-5394(03)00021-5. Bioelectrochemistry. 2003. PMID: 12893304
Cited by
-
Characterization of Cell Membrane Permeability In Vitro Part II: Computational Model of Electroporation-Mediated Membrane Transport.Technol Cancer Res Treat. 2018 Jan 1;17:1533033818792490. doi: 10.1177/1533033818792490. Technol Cancer Res Treat. 2018. PMID: 30231776 Free PMC article.
-
Irreversible electropermeabilization of the human pathogen Candida albicans: an in-vitro experimental study.Eur Biophys J. 2015 Feb;44(1-2):9-16. doi: 10.1007/s00249-014-0996-3. Epub 2014 Nov 9. Eur Biophys J. 2015. PMID: 25381646
-
Mechanisms of transfer of bioactive molecules through the cell membrane by electroporation.Eur Biophys J. 2015 Jul;44(5):277-89. doi: 10.1007/s00249-015-1025-x. Epub 2015 May 5. Eur Biophys J. 2015. PMID: 25939984 Review.
-
Induced transmembrane voltage and its correlation with electroporation-mediated molecular transport.J Membr Biol. 2010 Jul;236(1):3-13. doi: 10.1007/s00232-010-9279-9. Epub 2010 Jul 9. J Membr Biol. 2010. PMID: 20617432 Review.
-
Quantitative Limits on Small Molecule Transport via the Electropermeome - Measuring and Modeling Single Nanosecond Perturbations.Sci Rep. 2017 Mar 3;7(1):57. doi: 10.1038/s41598-017-00092-0. Sci Rep. 2017. PMID: 28246401 Free PMC article.
References
-
- Kinosita, K., and T. Y. Tsong. 1977. Voltage-induced pore formation and hemolysis of human erythrocytes. Biochim. Biophys. Acta. 471:227–242. - PubMed
-
- Barnett, A., and J. C. Weaver. 1991. Electroporation: a unified, quantitative theory of reversible electrical breakdown and rupture. Bioelectroch. Bioener. 25:163–182.
-
- Teissié, J., N. Eynard, B. Gabriel, and M. P. Rols. 1999. Electropermeabilization of cell membranes. Adv. Drug Deliver. Rev. 35:3–19. - PubMed
-
- Neumann, E., S. Kakorin, and K. Toensing. 1999. Fundamentals of electroporative delivery of drugs and genes. Bioelectroch. Bioener. 48:3–16. - PubMed
Publication types
MeSH terms
Substances
LinkOut - more resources
Full Text Sources
Miscellaneous
