In situ activation of antigen-specific CD8+ T cells in the presence of antigen in organotypic brain slices
- PMID: 18523307
- PMCID: PMC3338102
- DOI: 10.4049/jimmunol.180.12.8393
In situ activation of antigen-specific CD8+ T cells in the presence of antigen in organotypic brain slices
Abstract
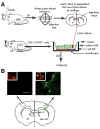
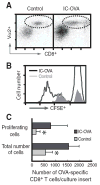
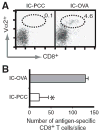
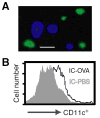
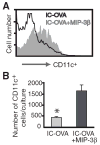
The activation of Ag-specific T cells locally in the CNS could potentially contribute to the development of immune-mediated brain diseases. We addressed whether Ag-specific T cells could be stimulated in the CNS in the absence of peripheral lymphoid tissues by analyzing Ag-specific T cell responses in organotypic brain slice cultures. Organotypic brain slice cultures were established 1 h after intracerebral OVA Ag microinjection. We showed that when OVA-specific CD8(+) T cells were added to Ag-containing brain slices, these cells became activated and migrated into the brain to the sites of their specific Ags. This activation of OVA-specific T cells was abrogated by the deletion of CD11c(+) cells from the brain slices of the donor mice. These data suggest that brain-resident CD11c(+) cells stimulate Ag-specific naive CD8(+) T cells locally in the CNS and may contribute to immune responses in the brain.
Conflict of interest statement
The authors have no financial conflict of interest.
Figures

Similar articles
-
Intestinal epithelial antigen induces mucosal CD8 T cell tolerance, activation, and inflammatory response.J Immunol. 2004 Oct 1;173(7):4324-30. doi: 10.4049/jimmunol.173.7.4324. J Immunol. 2004. PMID: 15383561
-
Efficient priming of CD4+ and CD8+ T cells by DNA vaccination depends on appropriate targeting of sufficient levels of immunologically relevant antigen to appropriate processing pathways.J Immunol. 2002 Nov 1;169(9):4951-60. doi: 10.4049/jimmunol.169.9.4951. J Immunol. 2002. PMID: 12391208
-
In situ processing and distribution of intracerebrally injected OVA in the CNS.J Neuroimmunol. 2003 Aug;141(1-2):90-8. doi: 10.1016/s0165-5728(03)00249-2. J Neuroimmunol. 2003. PMID: 12965258
-
Traumatic injury and the presence of antigen differentially contribute to T-cell recruitment in the CNS.J Neurosci. 2006 Jan 18;26(3):731-41. doi: 10.1523/JNEUROSCI.3502-05.2006. J Neurosci. 2006. PMID: 16421293 Free PMC article.
-
The induction and kinetics of antigen-specific CD8 T cells are defined by the stage specificity and compartmentalization of the antigen in murine toxoplasmosis.J Immunol. 2003 Feb 15;170(4):1949-57. doi: 10.4049/jimmunol.170.4.1949. J Immunol. 2003. PMID: 12574363
Cited by
-
Migration of cytotoxic lymphocytes in cell cycle permits local MHC I-dependent control of division at sites of viral infection.J Exp Med. 2011 Apr 11;208(4):747-59. doi: 10.1084/jem.20101295. Epub 2011 Apr 4. J Exp Med. 2011. PMID: 21464219 Free PMC article.
-
Regulatory T cells promote myelin regeneration in the central nervous system.Nat Neurosci. 2017 May;20(5):674-680. doi: 10.1038/nn.4528. Epub 2017 Mar 13. Nat Neurosci. 2017. PMID: 28288125 Free PMC article.
-
Conditional Silencing of H-2Db Class I Molecule Expression Modulates the Protective and Pathogenic Kinetics of Virus-Antigen-Specific CD8 T Cell Responses during Theiler's Virus Infection.J Immunol. 2020 Sep 1;205(5):1228-1238. doi: 10.4049/jimmunol.2000340. Epub 2020 Jul 31. J Immunol. 2020. PMID: 32737149 Free PMC article.
-
An ex vivo model of an oligodendrocyte-directed T-cell attack in acute brain slices.J Vis Exp. 2015 Feb 5;(96):52205. doi: 10.3791/52205. J Vis Exp. 2015. PMID: 25741800 Free PMC article.
-
Inflammation on the mind: visualizing immunity in the central nervous system.Curr Top Microbiol Immunol. 2009;334:227-63. doi: 10.1007/978-3-540-93864-4_10. Curr Top Microbiol Immunol. 2009. PMID: 19521688 Free PMC article. Review.
References
-
- Wekerle H. T-cell autoimmunity in the central nervous system. Intervirology. 1993;35:95–100. - PubMed
-
- Hickey WF. Leukocyte traffic in the central nervous system: the participants and their roles. Semin Immunol. 1999;11:125–137. - PubMed
-
- Hickey WF. Migration of hematogenous cells through the blood-brain barrier and the initiation of CNS inflammation. Brain Pathol. 1991;1:97–105. - PubMed
-
- Seabrook T, Au B, Dickstein J, Zhang X, Ristevski B, Hay JB. The traffic of resting lymphocytes through delayed hypersensitivity and chronic inflammatory lesions: a dynamic equilibrium. Semin Immunol. 1999;11:115–123. - PubMed
Publication types
MeSH terms
Substances
Grants and funding
LinkOut - more resources
Full Text Sources
Research Materials

