. 2008 Sep 15;414(3):471-84.
doi: 10.1042/BJ20080149.

The secretion inhibitor Exo2 perturbs trafficking of Shiga toxin between endosomes and the trans-Golgi network

Affiliations

The secretion inhibitor Exo2 perturbs trafficking of Shiga toxin between endosomes and the trans-Golgi network

Robert A Spooner et al. Biochem J. .

Abstract

The small-molecule inhibitor Exo2 {4-hydroxy-3-methoxy-(5,6,7,8-tetrahydrol[1]benzothieno[2,3-d]pyrimidin-4-yl)hydraz-one benzaldehyde} has been reported to disrupt the Golgi apparatus completely and to stimulate Golgi-ER (endoplasmic reticulum) fusion in mammalian cells, akin to the well-characterized fungal toxin BFA (brefeldin A). It has also been reported that Exo2 does not affect the integrity of the TGN (trans-Golgi network), or the direct retrograde trafficking of the glycolipid-binding cholera toxin from the TGN to the ER lumen. We have examined the effects of BFA and Exo2, and found that both compounds are indistinguishable in their inhibition of anterograde transport and that both reagents significantly disrupt the morphology of the TGN in HeLa and in BS-C-1 cells. However, Exo2, unlike BFA, does not induce tubulation and merging of the TGN and endosomal compartments. Furthermore, and in contrast with its effects on cholera toxin, Exo2 significantly perturbs the delivery of Shiga toxin to the ER. Together, these results suggest that the likely target(s) of Exo2 operate at the level of the TGN, the Golgi and a subset of early endosomes, and thus Exo2 provides a more selective tool than BFA for examining membrane trafficking in mammalian cells.


Figures

Figure 1
Figure 1. Synthesis of Exo2
The central thienopyrimidone unit (3) was constructed by condensation of cyanoamide with cyclohexanone in the presence of sulfur [27] to give aminothiophene (2) and cyclization with formamide [–30]. Chloride formation [31] and displacement gave the hydrazine (4) [32]. Condensation with vanillin (5) yielded Exo2 (1). The reactions in the scheme are: (a) piperidine/sulfur (b) formamide/reflux, (c) phosphorus chloride oxide/dimethylaniline, (d) hydrazine hydrate in methanol, (e) vanillin in methanol.
Figure 2
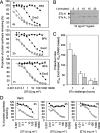
Figure 2. Exo2 treatment protects HeLa and Vero cells against STx challenge
(A) HeLa cells pre-treated with DMSO, DMSO/Exo2, ethanol vehicle (ethanol) or ethanol/BFA for 30 min at 37 °C were treated with graded doses (20 μg·ml−1 to 0.05 ng·ml−1) of STx in medium containing DMSO, DMSO/Exo2, ethanol, or ethanol/BFA as appropriate for 4 h (top panel), 2 h (middle panel) or 1 h (bottom panel), and their ability to synthesize proteins was subsequently determined. Typical single assays are shown. ○, DMSO-treated; ●, DMSO/Exo2-treated; □, ethanol-treated; ■, ethanol/BFA-treated. (B) STx was treated with trypsin (10 ng·ml−1) for various lengths of timeas indicated (min) at 37 °C, and the STx A chain (black arrowhead) and nicked STx A1 chain (white arrowhead) products were separated by reducing-gel electrophoresis and revealed by Coomassie Brilliant Blue staining. (C) DMSO- and DMSO/Exo2-pre-treated cells were challenged with graded doses of non-nicked (white bars) or pre-nicked (grey bars) STx as in (A) for the times indicated (1, 2 or 4 h) at 37 °C after treatment with 10 ng·ml−1 trypsin for 30 min at 37 °C in medium containing DMSO or DMSO/Exo2 as appropriate, and the sensitivities to toxin (IC50) were determined. The protective index is the ratio of IC50 Exo2-treated cells/IC50 control DMSO-treated cells. Results are means±S.D. (n=3) (D) Vero cells pre-treated with DMSO or DMSO/Exo2 for 30 min at 37 °C were treated with graded doses of STx in medium containing DMSO or DMSO/Exo2 as appropriate for the times indicated (1, 2 and 4 h) at 37 °C, and their ability to synthesize proteins subsequently was determined. Typical single assays are shown. ○, DMSO-treated; ●, DMSO/Exo2-treated.
Figure 3
Figure 3. Exo2 inhibits secretory transport of tsO45-G–YFP
HeLa cells were transfected with a plasmid encoding tsO45-G–YFP and incubated at 39.5 °C for 16 h to accumulate the protein in the ER. Cells were subsequently incubated at 39 °C for a further 2 h in the presence of DMSO (Control), 10 μg·ml−1 BFA or 50 μM Exo2. Cells were then temperature-shifted to 32 °C to allow export of tsO45-G–YFP from the ER for the times indicated (0, 30, 60 and 120 min).
Figure 4
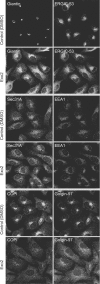
Figure 4. Steady-state localization of endomembranes is perturbed by Exo2
HeLa cells were incubated with 50 μM Exo2 for 2 h at 37 °C, followed by fixing and processing for immunofluorescence with antibodies specific for the proteins indicated. Cells were then imaged using confocal microscopy; images shown represent maximum intensity projections of ten z slices through each sample. Control is untreated cells incubated with DMSO.
Figure 5
Figure 5. Perturbation of Golgi and TGN markers by Exo2
(A) HeLa cells transfected with NAGFP were incubated in the presence of either BFA (upper panels) or 50 μM Exo2 (lower panels) at 37 °C and imaged using time-lapse microscopy immediately after the addition of inhibitors. Still images at 0, 10, or 20 min after the addition of inhibitors are shown. The asterisk (*) marks a Golgi apparatus that is relatively Exo2-resistant. (B and C) Cells were incubated with either DMSO or 50 μM Exo2 at 37 °C and fixed after incubation for various time points (0, 5, 60, 180 and 300 min) and processed for immunofluorescence using antibodies directed against TGN46 (B) or golgin-97 (C). Note that the panels in (B) and (C) are from the same cells, double-labelled for these markers. Arrows indicate re-emergence of juxtanuclear staining.
Figure 6
Figure 6. Quantification of organelle disruption by Exo2
Cells processed as in Figure 4 were quantified for TGN46 localization. The histogram shows the percentage of cells with disrupted TGN46 localization at the indicated time points after addition of DMSO (white bars) or Exo2 (grey bars). Results are means±S.D.
Figure 7
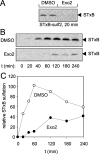
Figure 7. Exo2 treatment retards the sulfation of STxB chain
(A) Treatment of HeLa cells with Exo2 prevents sulfation of STxBsulf (arrowhead) 20 min post-internalization. Cells were pre-treated with 50 μM Exo2 for 30 min at 37 °C, incubated with STxB on ice and then further incubated for 20 min in the presence of Exo2 (see the Experimental section).(B) Time courses of STxB sulfation (arrowhead). Upper panel: during DMSO treatment; lower panel: during Exo2 treatment. Cells were pre-treated with 50 μM Exo2 for 30 min at 37 °C, incubated with STxB on ice and then further incubated for 0, 20, 40, 60, 120, 180 and 240 min in the presence of Exo2 (see the Experimental section). (C) Relative STxB sulfation profiles after DMSO (○) and Exo2 treatment (●; 50 μM Exo2), normalized to general sulfation levels.
Figure 8
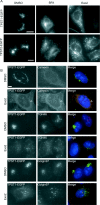
Figure 8. TPST1–EGFP predominantly localizes to the trans-Golgi
(A) TPST1–EGFP or TPST2–EGFP transiently expressed in HeLa cells at low levels of expression were imaged after treatment in the absence or presence of DMSO, BFA and 50 μM Exo2 for 2 h at 37 °C as indicated. Scale bar, 20 μm. (B) HeLa cells transiently expressing TPST1–EGFP were treated for 1 h at 37 °C with DMSO or 50 μM Exo2 diluted in culture medium, fixed and immunolabelled using the indicated antibodies. Typically, 10 stacks were acquired through the sample. For calnexin labelling, a single z slice is shown and the arrowhead points to the nuclear envelope. Other images shown represent the maximum projection of the z stacks. Indistinguishable results were obtained for TPST2–EGFP (results not shown). Scale bar, 5 μm.
Figure 9
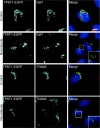
Figure 9. TPST1–EGFP co-localizes with GalT in nocodazole-induced mini Golgi stacks
TPST1–EGFP was expressed in HeLa cells which, where indicated, were incubated in the presence of nocodazole before fixing and immunolabelling for the Golgi marker GalT or the TGN marker TGN46 as indicated. Indistinguishable results were obtained using TPST2–EGFP (results not shown). Scale bar, 20 μm. Insets show 2× enlargements of the boxed regions. Note the absence of co-localization with TGN46.
Figure 10
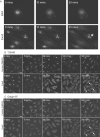
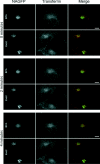
Figure 10. BFA, but not Exo2, induces tubulation of early endocytic compartments
Cells loaded with fluorescent transferrin for 5 min at 37 °C were imaged by time-lapse microscopy in the presence of either BFA (top panels) or 50 μM Exo2 (lower panels). The time-lapse sequence is included as Supplementary Movie S1 (see http://www.BiochemJ.org/bj/414/bj4140471add.htm), and still images taken at 0, 2 and 4 min after addition of BFA or Exo2 are shown. Note the extensive tubulation of EEs following the addition of BFA, which are never observed following the addition of Exo2. Scale bar, 20 μm.
Figure 11
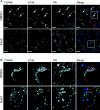
Figure 11. Exo2 inhibits transit of STxB to the TGN
(A) HeLa cells were pre-treated with 50 μM Exo2 for 30 min at 37 °C, stained with Cy3-labelled STxB (red) on ice followed by warming to 37 °C for 90 min in the presence of Exo2. Cells were fixed and immunolabelled with antibodies against TGN46 (green) and the TfR (blue). Extensive co-localization of TGN46 and STxB is seen in control cells (arrows), but not in Exo2-treated samples. STxB also did not co-localize with TGN46 at either 45 min or 120 min at 37 °C (results not shown) in Exo2-treated cells. TfR labelling is also seen in close proximity to that of STxB and TGN46 in controls, but not in Exo2-treated cells. Images shown are maximum intensity projections of 10 confocal z slices (pinhole at 1 Airy unit) that have been processed in Volocity 4.3 (Improvision) with a low-pass noise filter. Scale bar, 10 μm. (B) Enlargements (×4) of the boxed regions.

Similar articles

Cited by

References

    1. Bonifacino J. S., Glick B. S. The mechanisms of vesicle budding and fusion. Cell. 2004;116:153–166. - PubMed
    1. Schekman R., Novick P. 23 genes, 23 years later. Cell. 2004;116:S13–S15. - PubMed
    1. Donaldson J. G., Lippincott-Schwartz J., Bloom G. S., Kreis T. E., Klausner R. D. Dissociation of a 110-kD peripheral membrane protein from the Golgi apparatus is an early event in brefeldin A action. J. Cell Biol. 1990;111:2295–2306. - PMC - PubMed
    1. Orci L., Tagaya M., Amherdt M., Perrelet A., Donaldson J. G., Lippincott-Schwartz J., Klausner R. D., Rothman J. E. Brefeldin A, a drug that blocks secretion, prevents the assembly of non-clathrin-coated buds on Golgi cisternae. Cell. 1991;64:1183–1195. - PubMed
    1. Lippincott-Schwartz J., Yuan L. C., Bonifacino J. S., Klausner R. D. Rapid redistribution of Golgi proteins into the ER in cells treated with brefeldin A: evidence for membrane cycling from Golgi to ER. Cell. 1989;56:801–813. - PMC - PubMed

MeSH terms

Substances