. 2008 Jun 9;205(6):1477-90.
doi: 10.1084/jem.20072194. Epub 2008 May 26.

Membrane traffic and turnover in TRP-ML1-deficient cells: a revised model for mucolipidosis type IV pathogenesis

Affiliations

Membrane traffic and turnover in TRP-ML1-deficient cells: a revised model for mucolipidosis type IV pathogenesis

Mark T Miedel et al. J Exp Med. .

Abstract

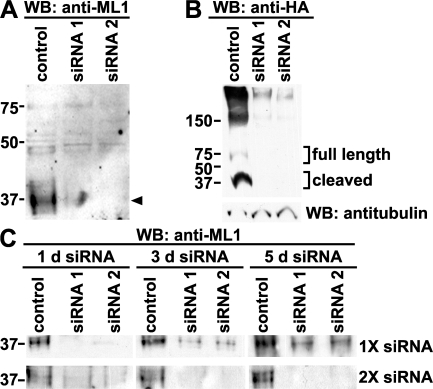
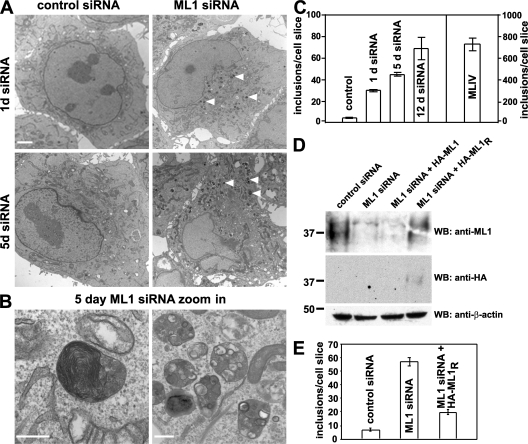
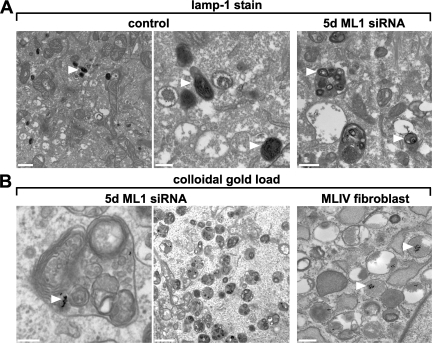
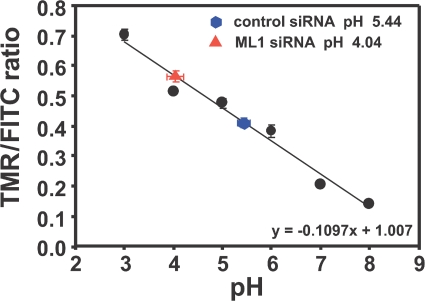
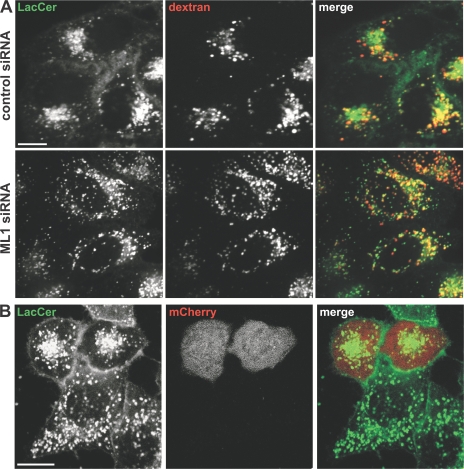
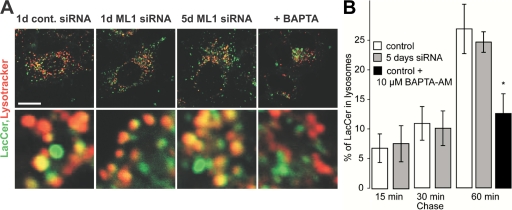
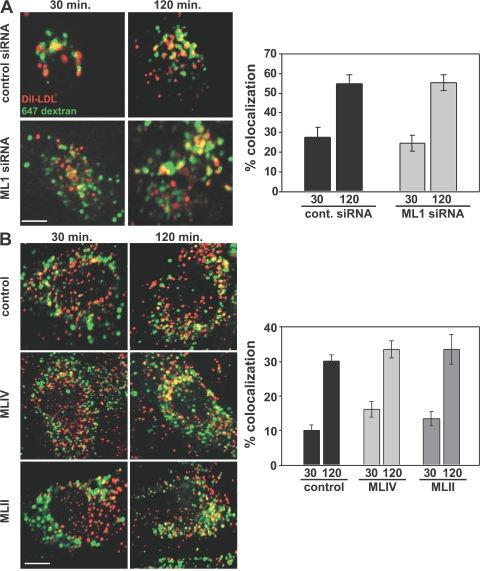
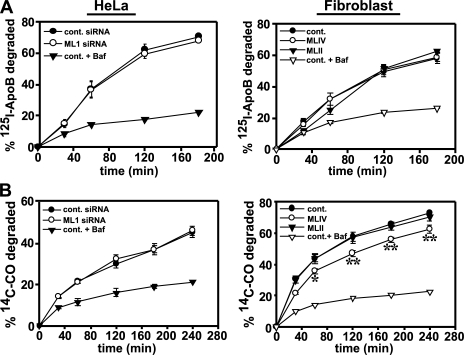
The lysosomal storage disorder mucolipidosis type IV (MLIV) is caused by mutations in the transient receptor potential-mucolipin-1 (TRP-ML1) ion channel. The "biogenesis" model for MLIV pathogenesis suggests that TRP-ML1 modulates postendocytic delivery to lysosomes by regulating interactions between late endosomes and lysosomes. This model is based on observed lipid trafficking delays in MLIV patient fibroblasts. Because membrane traffic aberrations may be secondary to lipid buildup in chronically TRP-ML1-deficient cells, we depleted TRP-ML1 in HeLa cells using small interfering RNA and examined the effects on cell morphology and postendocytic traffic. TRP-ML1 knockdown induced gradual accumulation of membranous inclusions and, thus, represents a good model in which to examine the direct effects of acute TRP-ML1 deficiency on membrane traffic. Ratiometric imaging revealed decreased lysosomal pH in TRP-ML1-deficient cells, suggesting a disruption in lysosomal function. Nevertheless, we found no effect of TRP-ML1 knockdown on the kinetics of protein or lipid delivery to lysosomes. In contrast, by comparing degradation kinetics of low density lipoprotein constituents, we confirmed a selective defect in cholesterol but not apolipoprotein B hydrolysis in MLIV fibroblasts. We hypothesize that the effects of TRP-ML1 loss on hydrolytic activity have a cumulative effect on lysosome function, resulting in a lag between TRP-ML1 loss and full manifestation of MLIV.


Figures

Figure 1.
Figure 1.
siRNA-mediated knockdown of TRP-ML1. (A) HeLa cells were transfected with either nonsilencing control or TRP-ML1–specific siRNA oligonucleotides. Cells were harvested for Western blot analysis after 24 h. Equal amounts of total protein were loaded for SDS-PAGE, as determined by protein assay. Samples were transferred to nitrocellulose and immunoblotted to detect endogenous levels of TRP-ML1 using an antibody directed against the first extracellular loop of the protein. The arrowhead denotes the migration of the cleaved form of TRP-ML1. (B) HeLa cells were transiently transfected with cDNA encoding HA epitope–tagged TRP-ML1 24 h after initial transfection with either control or TRP-ML1–specific siRNA duplexes. After an additional 24-h incubation, cells were solubilized and equal amounts of total protein were immunoprecipitated using anti-HA antibodies. After SDS-PAGE, proteins were transferred to nitrocellulose and probed using horseradish peroxidase–conjugated anti-HA antibody. 10% of the cell lysate was saved before immunoprecipitation and immunoblotted using antitubulin antibody as an additional loading control (bottom). (C) HeLa cells were transfected with either nonsilencing control or TRP-ML1–specific siRNA oligonucleotides and were harvested for Western blot analysis 1, 3, or 5 d after transfection (top), or were retransfected with siRNA duplexes after 2 d and were harvested for Western analysis at 3 or 5 d (bottom). Samples were subjected to SDS-PAGE, transferred to nitrocellulose, and immunoblotted to detect endogenous TRP-ML1. The migration of molecular mass markers (in kD) is noted on the left of the blots.
Figure 2.
Figure 2.
Time course of lipid inclusion formation in TRP-ML–deficient cells. (A and B) Electron micrographs of HeLa cells after either 1 or 5 d of TRP-ML1–specific or control siRNA oligonucleotide transfection. Bars: (A) 2 μm; (B, left) 200 nm; (B, right) 500 nm. (C) Quantitation of the effect of TRP-ML1 knockdown on the formation of storage inclusions. The number of inclusions was calculated using the automated particle counting function of ImageJ. Data are expressed as the number of inclusions per cell slice ± SEM (D) Western blot analysis of siRNA-treated cells expressing siRNA-resistant HA-ML1R. HeLa cells were transfected with either control or TRP-ML1–specific siRNA, as indicated. 24 h after siRNA treatment, cells were cotransfected with plasmids encoding GFP and either HA-ML1 (non-siRNA resistant) or HA-ML1R (siRNA resistant). The next day, cells were sorted by FACS analysis to identify GFP-positive (transfected) cells and were subsequently retransfected with the appropriate siRNA and returned to culture for 48 h. Cells were harvested, and 30 μg of total protein was loaded for SDS-PAGE. Samples were transferred to nitrocellulose and immunoblotted to detect endogenous levels of TRP-ML1 (top), HA-ML1 or HA-ML1R (middle), or β-actin (bottom) as a loading control. (E) Quantitation of the effect of HA-ML1R expression on formation of storage inclusions in TRP-ML1 siRNA–treated cells. The number of inclusions was calculated as described in C. The migration of molecular mass markers (in kD) is noted on the left of the blots.
Figure 3.
Figure 3.
Inclusion bodies are lamp-1 positive and remain accessible to internalized cargo in TRP-ML–deficient cells. (A) Lamp-1 immunoreactivity in control and TRP-ML–deficient cells is indicated by arrowheads. Control or TRP-ML1 siRNA–treated HeLa cells (5 d) were labeled with antibodies directed against the lysosomal membrane protein lamp-1, as described in Materials and methods. Lysosomes from both control and TRP-ML1 siRNA–treated cells are positive for lamp-1 immunoreactivity. Arrowheads indicate lamp-1–positive labeled compartments. Bars: (left) 2 μm; (middle) 500 nm; (right) 500 nm. (B) Colloidal gold inside storage inclusions in TRP-ML–deficient cells. Control or TRP-ML1 siRNA–treated HeLa cells (5 d) were loaded with 10-nm colloidal gold particles and processed for electron microscopy as described in Materials and methods. A large fraction of the inclusions was gold positive in 5-d siRNA cells, indicating that the inclusions were recently formed. Gold was chased for 16 h. Arrowheads indicate colloidal gold–labeled compartments. Bars: (left) 200 nm; (middle) 2 μm; (right) 500 nm.
Figure 4.
Figure 4.
Lysosomal pH is lower in TRP-ML1 siRNA–treated cells. Control or TRP-ML1 siRNA–treated (5 d) HeLa cells were loaded with 3 mg/ml of FITC- and TMR-conjugated dextrans for 12 h. Lysosomal pH was determined by calculating the ratio of TMR/FITC fluorescence. Images were acquired as described in Materials and methods. Ratiometric data were converted to absolute values of pH using TMR/FITC ratios determined from permeabilized cells equilibrated with calibration solutions. Data from 20 random fields of cells were quantified, and the pH determined is presented as mean pH ± SEM. Similar results were obtained in four independent experiments.
Figure 5.
Figure 5.
Postlysosomal lipid traffic is impaired in TRP-ML–deficient cells. (A) Control or TRP-ML1 siRNA–treated (5 d) HeLa cells were preloaded for 12 h with Alexa Fluor 647–conjugated dextran. The next day, cells were labeled with LacCer, as described in Materials and methods, and chased for 5 h. Fluorescence images of both LacCer (green) and Alexa Fluor 647–dextran (red) were obtained for both control (top) and TRP-ML1 siRNA–treated (bottom) cells. Bar, 10 μm. (B) LacCer Golgi localization can be restored by expression of HA-ML1R in TRP-ML1 siRNA–treated cells. TRP-ML1 siRNA–treated cells (2 d) were cotransfected with plasmids encoding the siRNA-resistant construct HA-MLR cDNA and the fluorescent protein mCherry (to identify DNA-transfected cells) 24 h before siRNA treatment. Cells were loaded and chased with LacCer as in A. The juxtanuclear LacCer staining pattern reminiscent of normal cells is observed in mCherry-positive cells but not in neighboring cells that presumably do not express HA-ML1R. Bar, 10 μM.
Figure 6.
Figure 6.
Lysosomal delivery of LacCer is normal in TRP-ML1 siRNA–treated cells. (A) Control and TRP-ML1 siRNA–treated cells were loaded with 2 μg/ml LacCer for 15 min at 37°C and LysoTracker Red to label lysosomes, as described in Materials and methods. Bar, 10 μm. (B) Where indicated, cells were incubated with 10 μM BAPTA-AM for 1 h. Delivery of LacCer to lysosomes was measured by quantifying the percent overlap between LacCer and LysoTracker. Data are mean ± SEM. *, P = 0.013 (obtained in six separate measurements).
Figure 7.
Figure 7.
LDL delivery to lysosomes is normal in TRP-ML–deficient cells. Control or TRP-ML1 siRNA–treated (5 d) HeLa cells (A) or fibroblasts (B) were preloaded for 12 h with Alexa Fluor 647–conjugated dextran. Cells were incubated with DiI-LDL on ice for 60 min and were subsequently chased in prewarmed media at 37°C for an additional 30 or 120 min. At the indicated time points, cells were fixed and processed for immunofluorescence. Delivery of DiI-LDL to lysosomes in cells was measured by quantifying the percent overlap between DiI-LDL and the preloaded Alexa Fluor 647–dextran. Graphical representations of the quantifications are shown (A and B, right) and are expressed as the percent overlap ± SEM for cells under each condition (n = 20). Bars, 10 μm.
Figure 8.
Figure 8.
Degradation of LDL cholesterol is impaired in MLIV fibroblasts. (A) siRNA-transfected HeLa (5 d) or patient fibroblasts were incubated on ice for 2 h with 125I-apoB-LDL complexes. For control cells, 0.5 μM bafilomycin was added 30 min before LDL labeling and maintained in the culture medium throughout the experiment. After ligand binding, cells were washed and incubated in prewarmed medium. At the indicated time points, the medium was collected and replaced, and cells were solubilized after the final time point. The rate of apoB degradation was determined by calculating the cumulative release of TCA-soluble counts into the medium, as described in Materials and methods. (B) siRNA-transfected HeLa (5 d) or patient fibroblasts were labeled with medium containing 10% LPDS and [14C]CO–LDL complexes (50 μg/ml LDL protein) for 4 h at 37°C, washed, and incubated for 30 min at 18°C in medium supplemented with 10% FBS. The time course was initiated by the addition of fresh culture medium supplemented with 10% LPDS at 37°C. At the indicated times, the medium was collected and replaced. After the final time point, cells were harvested, and radioactivity was measured in both the medium and cell pellet. The cumulative percentage of preinternalized [14C]CO released into the medium at each time point was calculated as described in Materials and methods. The mean ± SEM of three experiments (two for bafilomycin A1–treated samples) performed in triplicate is plotted in each panel. *, P = 0.032; and **, P < 0.008 by using the Student's t test.

Similar articles

Cited by

References

    1. Bargal, R., N. Avidan, E. Ben-Asher, Z. Olender, M. Zeigler, A. Frumkin, A. Raas-Rothschild, G. Glusman, D. Lancet, and G. Bach. 2000. Identification of the gene causing mucolipidosis type IV. Nat. Genet. 26:118–123. - PubMed
    1. Bassi, M.T., M. Manzoni, E. Monti, M.T. Pizzo, A. Ballabio, and G. Borsani. 2000. Cloning of the gene encoding a novel integral membrane protein, mucolipidin–and identification of the two major founder mutations causing mucolipidosis type IV. Am. J. Hum. Genet. 67:1110–1120. - PMC - PubMed
    1. Slaugenhaupt, S.A., J.S. Acierno Jr., L.A. Helbling, C. Bove, E. Goldin, G. Bach, R. Schiffmann, and J.F. Gusella. 1999. Mapping of the mucolipidosis type IV gene to chromosome 19p and definition of founder haplotypes. Am. J. Hum. Genet. 65:773–778. - PMC - PubMed
    1. Sun, M., E. Goldin, S. Stahl, J.L. Falardeau, J.C. Kennedy, J.S. Acierno Jr., C. Bove, C.R. Kaneski, J. Nagle, M.C. Bromley, et al. 2000. Mucolipidosis type IV is caused by mutations in a gene encoding a novel transient receptor potential channel. Hum. Mol. Genet. 9:2471–2478. - PubMed
    1. Bach, G. 2001. Mucolipidosis type IV. Mol. Genet. Metab. 73:197–203. - PubMed

Publication types