Targeted deficiency of the transcriptional activator Hnf1alpha alters subnuclear positioning of its genomic targets
- PMID: 18497863
- PMCID: PMC2375116
- DOI: 10.1371/journal.pgen.1000079
Targeted deficiency of the transcriptional activator Hnf1alpha alters subnuclear positioning of its genomic targets
Abstract
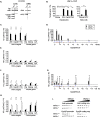
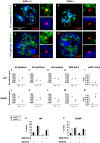
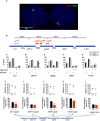
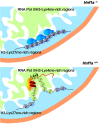
DNA binding transcriptional activators play a central role in gene-selective regulation. In part, this is mediated by targeting local covalent modifications of histone tails. Transcriptional regulation has also been associated with the positioning of genes within the nucleus. We have now examined the role of a transcriptional activator in regulating the positioning of target genes. This was carried out with primary beta-cells and hepatocytes freshly isolated from mice lacking Hnf1alpha, an activator encoded by the most frequently mutated gene in human monogenic diabetes (MODY3). We show that in Hnf1a-/- cells inactive endogenous Hnf1alpha-target genes exhibit increased trimethylated histone H3-Lys27 and reduced methylated H3-Lys4. Inactive Hnf1alpha-targets in Hnf1a-/- cells are also preferentially located in peripheral subnuclear domains enriched in trimethylated H3-Lys27, whereas active targets in wild-type cells are positioned in more central domains enriched in methylated H3-Lys4 and RNA polymerase II. We demonstrate that this differential positioning involves the decondensation of target chromatin, and show that it is spatially restricted rather than a reflection of non-specific changes in the nuclear organization of Hnf1a-deficient cells. This study, therefore, provides genetic evidence that a single transcriptional activator can influence the subnuclear location of its endogenous genomic targets in primary cells, and links activator-dependent changes in local chromatin structure to the spatial organization of the genome. We have also revealed a defect in subnuclear gene positioning in a model of a human transcription factor disease.
Conflict of interest statement
The authors have declared that no competing interests exist.
Figures


Similar articles
-
Hnf1alpha (MODY3) controls tissue-specific transcriptional programs and exerts opposed effects on cell growth in pancreatic islets and liver.Mol Cell Biol. 2009 Jun;29(11):2945-59. doi: 10.1128/MCB.01389-08. Epub 2009 Mar 16. Mol Cell Biol. 2009. PMID: 19289501 Free PMC article.
-
HNF1α controls glucagon secretion in pancreatic α-cells through modulation of SGLT1.Biochim Biophys Acta Mol Basis Dis. 2020 Nov 1;1866(11):165898. doi: 10.1016/j.bbadis.2020.165898. Epub 2020 Jul 22. Biochim Biophys Acta Mol Basis Dis. 2020. PMID: 32711050 Free PMC article.
-
Embryonic but not postnatal reexpression of hepatocyte nuclear factor 1alpha (HNF1alpha) can reactivate the silent phenylalanine hydroxylase gene in HNF1alpha-deficient hepatocytes.Mol Cell Biol. 2001 Jun;21(11):3662-70. doi: 10.1128/MCB.21.11.3662-3670.2001. Mol Cell Biol. 2001. PMID: 11340160 Free PMC article.
-
Roles of HNF1α and HNF4α in pancreatic β-cells: lessons from a monogenic form of diabetes (MODY).Vitam Horm. 2014;95:407-23. doi: 10.1016/B978-0-12-800174-5.00016-8. Vitam Horm. 2014. PMID: 24559927 Review.
-
Chromatin organization and transcriptional regulation.Curr Opin Genet Dev. 2013 Apr;23(2):89-95. doi: 10.1016/j.gde.2012.11.006. Epub 2012 Dec 24. Curr Opin Genet Dev. 2013. PMID: 23270812 Free PMC article. Review.
Cited by
-
Dynamic chromatin remodeling mediated by polycomb proteins orchestrates pancreatic differentiation of human embryonic stem cells.Cell Stem Cell. 2013 Feb 7;12(2):224-37. doi: 10.1016/j.stem.2012.11.023. Epub 2013 Jan 11. Cell Stem Cell. 2013. PMID: 23318056 Free PMC article.
-
Gene positioning.Cold Spring Harb Perspect Biol. 2010 Jun;2(6):a000588. doi: 10.1101/cshperspect.a000588. Epub 2010 May 19. Cold Spring Harb Perspect Biol. 2010. PMID: 20484389 Free PMC article. Review.
-
Hnf1alpha (MODY3) controls tissue-specific transcriptional programs and exerts opposed effects on cell growth in pancreatic islets and liver.Mol Cell Biol. 2009 Jun;29(11):2945-59. doi: 10.1128/MCB.01389-08. Epub 2009 Mar 16. Mol Cell Biol. 2009. PMID: 19289501 Free PMC article.
-
TEAD and YAP regulate the enhancer network of human embryonic pancreatic progenitors.Nat Cell Biol. 2015 May;17(5):615-626. doi: 10.1038/ncb3160. Epub 2015 Apr 27. Nat Cell Biol. 2015. PMID: 25915126 Free PMC article.
-
HNF1α maintains pancreatic α and β cell functions in primary human islets.JCI Insight. 2023 Dec 22;8(24):e170884. doi: 10.1172/jci.insight.170884. JCI Insight. 2023. PMID: 37943614 Free PMC article.
References
-
- Kadonaga JT. Regulation of RNA polymerase II transcription by sequence-specific DNA binding factors. Cell. 2004;116:247–257. - PubMed
-
- Kosak ST, Groudine M. Form follows function: the genomic organization of cellular differentiation. Genes Dev. 2004;18:1371–1384. - PubMed
-
- van Driel R, Fransz PF, Verschure PJ. The eukaryotic genome: a system regulated at different hierarchical levels. J Cell Sci. 2003;116:4067–4075. - PubMed
-
- Jenuwein T, Allis CD. Translating the histone code. Science. 2001;293:1074–1080. - PubMed
Publication types
MeSH terms
Substances
LinkOut - more resources
Full Text Sources
Molecular Biology Databases

