. 2008 Jul;14(7):1337-51.
doi: 10.1261/rna.864908. Epub 2008 May 21.

Yeast translational response to high salinity: global analysis reveals regulation at multiple levels

Affiliations

Yeast translational response to high salinity: global analysis reveals regulation at multiple levels

Daniel Melamed et al. RNA. 2008 Jul.

Abstract

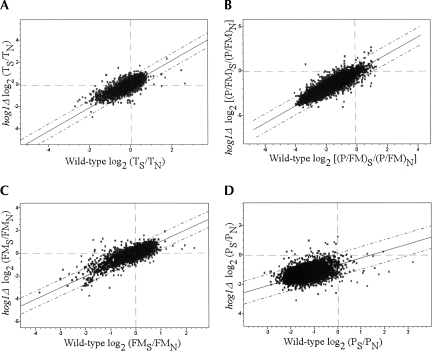
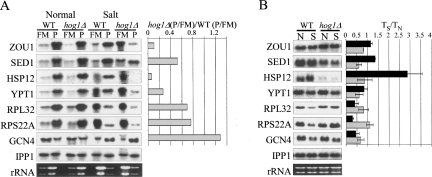
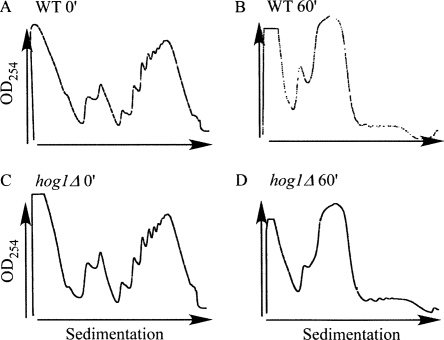
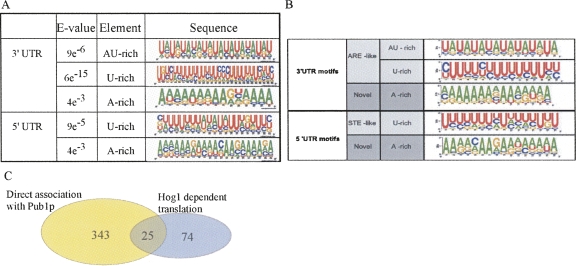
Genome-wide studies of steady-state mRNA levels revealed common principles underlying transcriptional changes in response to external stimuli. To uncover principles that govern other stages of the gene-expression response, we analyzed the translational response and its coordination with transcriptome changes following exposure to severe stress. Yeast cells were grown for 1 h in medium containing 1 M NaCl, which elicits a maximal but transient translation inhibition, and nonpolysomal or polysomal mRNA pools were subjected to DNA-microarray analyses. We observed a strong repression in polysomal association for most mRNAs, with no simple correlation with the changes in transcript levels. This led to an apparent accumulation of many mRNAs as a nontranslating pool, presumably waiting for recovery from the stress. However, some mRNAs demonstrated a correlated change in their polysomal association and their transcript levels (i.e., potentiation). This group was enriched with targets of the transcription factors Msn2/Msn4, and the translational induction of several tested mRNAs was diminished in an Msn2/Msn4 deletion strain. Genome-wide analysis of a strain lacking the high salinity response kinase Hog1p revealed that the group of translationally affected genes is significantly enriched with motifs that were shown to be associated with the ARE-binding protein Pub1. Since a relatively small number of genes was affected by Hog1p deletion, additional signaling pathways are likely to be involved in coordinating the translational response to severe salinity stress.


Figures

FIGURE 1.
FIGURE 1.
Time course analysis and experimental strategy used to study the translational response to high salinity. (A) Cells grown in optimal medium (YPD) to the midlogarithmic phase were subjected to 1 M NaCl stress for the indicated times. Cells were harvested and complexes were separated by velocity sedimentation in sucrose gradients. The sedimentation profile of ribosomal complexes was determined by measuring the OD254 along the gradient. The dashed line indicates the partition line between mRNAs free of ribosomes or associated with monosome (FM) and mRNAs associated with polyribosomes (P). The percent of signal obtained in the P region is indicated in each panel. (B) Northern analysis of changes in transcript levels following exposure to 1 M NaCl. Cells were harvested at the indicated time points (identical to the time points in the polysomal analysis, panel A). RNA was extracted from the samples and subjected to Northern analysis using the indicated probes. (C) Scheme of the procedure for translational profiling. Sucrose density gradients from time points 0 min (normal, N) and 60 min (salt, S) were fractionated to free and monosomal (FM) or polysomal (P) mRNA. Each pool was converted to Cy5-labeled cDNA, mixed with Cy3 labeled unfractionated RNA from an unrelated sample (reference RNA), and hybridized to a DNA microarray. Slanted arrows represent the spike-in RNA that was added to each sample in equal amounts. (D) Scheme of the transcriptome analysis. Unfractionated RNA was extracted from these two time points (TN, TS), labeled differentially, and hybridized together to a DNA microarray. Note that the same cell culture was used for both C and D in order to reduce technical variation.
FIGURE 2.
FIGURE 2.
Comparison between microarray and Northern results of several candidate genes. (A) Sucrose gradients from cells grown in normal (N) conditions (i.e., YPD) or after 60 min growth in 1 M NaCl (S) were fractionated to two fractions representing free and monosomal (FM) or polysomal (P) mRNA. RNA samples were subjected to Northern analysis using probes recognizing the indicated mRNAs. Transcript levels comparison (right panels) was done by analyzing 5 μg of unfractionated RNA collected from either N or S conditions. (B) Quantified signals from three biological replicates (either microarray [black bars] or Northern [gray bars]) were used to determine the average fold change in steady-state transcript levels for the indicated genes. IPP1 probe was used to normalize for loading variations because it shows no significant change following high salinity stress (Rep et al. 1999a; this study). (C) Quantified signals from three biological replicates (either microarray or Northern) were used to determine the average change in P/FM ratios for the indicated genes. Signals were normalized to an mRNA spike (PHE) that was added in equal amounts to each fraction immediately at collection. (D) Western analysis and pulse labeling of TAP tagged proteins. For Western analyses, the indicated strains were grown in optimal media (YPD) and shifted for 1-h growth to medium containing 1 M NaCl. Protein extracts were prepared from the cells, and equal amounts were subjected to Western analysis using peroxidase anti peroxidase antibody. For pulse labeling, cells were grown overnight in minimal medium with only the necessary amino acids but without methionine. Half of the cells were shifted to a medium supplemented with 1 M NaCl for another 1 h of growth. 35S-methionine was added to the cells 20 min before harvesting. Labeled proteins were immunopercipitated using IgG-sepharose beads, resolved on a gel, and exposed to a PhophorImager. N indicates no salt stress and S indicated salt stress.
FIGURE 3.
FIGURE 3.
Graphical representations of the relationships between translational changes and changes in the transcriptome. (A–C) Changes in ribosomal association following salt stress, calculated as [log2(FMS/FMN)](A), [log2(PS/PN)] (B), and (log2[(P/FM)S/(P/FM)N]) (C), were plotted against their respective changes in transcript levels (TS/TN). The best-fit linear trend lines are marked, and their slope and R 2 values are indicated. Dashed lines represent two standard deviations (2 SD) from the trend line. Genes that were tested by Northern analysis and disussed in the text are indicated by arrows. (D) A model explaining the inverse relationship between the global translational response and the transcriptome response. (Top) The translational status of three representative genes. For simplicity, at optimal growth conditions, five mRNA molecules of each gene are free of ribosomes (FM) and five are associated with translating ribosomes (P), thereby yielding a P/FM of one. (Middle) Following 1 h of high salinity stress, mRNA molecules are shifted from the P pool to the FM pool in an identical manner for all genes. (Bottom) Concomitant with the translational change or soon after, changes in mRNA transcript levels take place only within the FM fraction. For some genes, a fast degradation (left) occurs, leading to an apparent low P/FM. For other mRNAs (middle), no change occurs in transcript levels. Finally, transcription induced for some genes may lead to an increase in mRNA levels and a decrease in P/FM (right). Thus, although the shift from P to FM was similar to all genes, the changes in mRNA levels, which are reflected mainly in the FM fraction, lead to the apparent inverse correlation between changes in T and changes in P/FM.
FIGURE 4.
FIGURE 4.
Bar diagrams of translationally regulated genes grouped by their common processes. The bars indicate the total number of translationally induced genes (A) or translationally repressed genes (B). The black section in each bar indicates the proportion of genes that are within the top 5% of genes having the highest change in transcript levels.
FIGURE 5.
FIGURE 5.
Effect of deletion of MSN2/MSN4 genes. (A) Translational response. Yeast strains either carrying (WT) or deleted (Δ) of MSN2/MSN4 genes were grown for 60 min in YPD supplemented with 1 M NaCl, and then subjected to polysomal analysis. RNA samples from FM and P fractions were used for Northern analyses using the indicated probes. The histograms present the ratio between the P/FM of the deletion strain and the normal strain after normalization according to the signals of the PHE mRNA. (B) Transcript changes. RNA samples (5 μg each) from wild-type (WT) or Msn2Δ/Msn4Δ (Δ) cells grown either in normal (N) or salt (S) conditions were subjected to Northern analysis. Black and gray bars represent the ratio of S to N signals in the WT and deletion strain, respectively. Loading variations were corrected according to the IPP1 signals.
FIGURE 7.
FIGURE 7.
Comparisons of the transcriptome and translational response of hog1Δ and wild-type strains to high salinity. (A) Average values of changes due to salt stress in the hog1Δ transcriptome are plotted against the wild-type average change. The best-fit linear trend line and two SD lines (dashed lines) are shown. (B–D) Comparison of hog1Δ and wild-type changes in P/FM (B), FM (C), and P (D) due to salt stress. The results from one representative experiment are shown. Genes that deviated by more than two SD from the trend line were considered as translationally misregulated in hog1Δ cells. Note that for the analysis presented in the Results, genes were further filtered based on the results from the other two experiments (see Materials and Methods for filtration details).
FIGURE 8.
FIGURE 8.
Validation of hog1Δ translationally misregulated genes by Northern analysis. (A) Sucrose gradients from wild-type (WT) or hog1Δ cells grown in rich medium (normal) or after 60 min growth in 1 M NaCl (salt) were fractionated to free and monosomal (FM) or polysomal (P) mRNA. RNA samples were subjected to Northern analysis using the indicated probes. The histogram presents the ratio between the P/FM of the deletion strain and the normal strain after normalization according to the signals of the PHE mRNA. (B) Transcript changes. RNA samples (5 μg each) from wild-type or hog1Δ cells grown either in normal or salt conditions were subjected to Northern analysis. Black and gray bars represent the ratio of S to N signals in the WT and deletion strain, respectively. Loading variations were corrected according to the IPP1 signals.
FIGURE 6.
FIGURE 6.
Polysomal profiles for wild-type and hog1Δ cells. (A) Wild-type cells grown under normal conditions (before shift to salt conditions). (B) Wild-type cells after 60 min of 1 M NaCl stress. (C) hog1Δ cells grown at normal conditions. (D) hog1Δ cells after 60 min of 1 M NaCl stress.
FIGURE 9.
FIGURE 9.
Sequence analysis of genes that are translationally regulated by Hog1. (A) Sequences upstream (100 nt) or downstream (200 nt) of each of the affected ORFs were used for classification by the MEME algorithm (Bailey et al. 2006). Shown are motifs that were significantly enriched in either upstream (5′ UTR) or downstream (3′ UTR) regions of the ORF. (B) Sequence motifs of Pub1 targets. Analysis was performed as in A. The figure is reprinted with permission from Duttagupta et al. (2005); © 2005 the American Society for Microbiology. (C) Venn diagram representing the number of mRNAs that were shown to be associated with Pub1p (Duttagupta et al. 2005) and the mRNAs that showed a Hog1-dependent translation. The P-value for the overlap is 2.6e−10 (Fisher test).

Similar articles

Cited by

References

    1. Albertyn J., Hohmann S., Thevelein J.M., Prior B.A. GPD1, which encodes glycerol-3-phosphate dehydrogenase, is essential for growth under osmotic stress in Saccharomyces cerevisiae, and its expression is regulated by the high-osmolarity glycerol response pathway. Mol. Cell. Biol. 1994;14:4135–4144. - PMC - PubMed
    1. Alwine J.C., Kemp D.J., Stark G.R. Method for detection of specific RNAs in agarose gels by transfer to diazobenzyloxymethyl-paper and hybridization with DNA probes. Proc. Natl. Acad. Sci. 1977;74:5350–5354. - PMC - PubMed
    1. Arava Y., Wang Y., Storey J.D., Liu C.L., Brown P.O., Herschlag D. Genome-wide analysis of mRNA translation profiles in Saccharomyces cerevisiae . Proc. Natl. Acad. Sci. 2003;100:3889–3894. - PMC - PubMed
    1. Ashe M.P., De Long S.K., Sachs A.B. Glucose depletion rapidly inhibits translation initiation in yeast. Mol. Biol. Cell. 2000;11:833–848. - PMC - PubMed
    1. Ashe M.P., Slaven J.W., De Long S.K., Ibrahimo S., Sachs A.B. A novel eIF2B-dependent mechanism of translational control in yeast as a response to fusel alcohols. EMBO J. 2001;20:6464–6474. - PMC - PubMed

Publication types

MeSH terms

Substances

LinkOut - more resources