. 2008 May;14(5):798-809.
doi: 10.1016/j.devcel.2008.04.002.

Differential H3K4 methylation identifies developmentally poised hematopoietic genes

Affiliations

Differential H3K4 methylation identifies developmentally poised hematopoietic genes

Keith Orford et al. Dev Cell. 2008 May.

Abstract

Throughout development, cell fate decisions are converted into epigenetic information that determines cellular identity. Covalent histone modifications are heritable epigenetic marks and are hypothesized to play a central role in this process. In this report, we assess the concordance of histone H3 lysine 4 dimethylation (H3K4me2) and trimethylation (H3K4me3) on a genome-wide scale in erythroid development by analyzing pluripotent, multipotent, and unipotent cell types. Although H3K4me2 and H3K4me3 are concordant at most genes, multipotential hematopoietic cells have a subset of genes that are differentially methylated (H3K4me2+/me3-). These genes are transcriptionally silent, highly enriched in lineage-specific hematopoietic genes, and uniquely susceptible to differentiation-induced H3K4 demethylation. Self-renewing embryonic stem cells, which restrict H3K4 methylation to genes that contain CpG islands (CGIs), lack H3K4me2+/me3- genes. These data reveal distinct epigenetic regulation of CGI and non-CGI genes during development and indicate an interactive relationship between DNA sequence and differential H3K4 methylation in lineage-specific differentiation.


Figures

Figure 1.
Figure 1.. The Distribution of H3K4me2 Enrichment at Lineage-Specific Hematopoietic Promoters Reflects the Differentiation Potential of Hematopoietic Cell Lines
(A) Primary cells were purified from mouse bone marrow (multipotential and erythroid cells) and spleen (B lymphoid cells), and anti-H3K4me2 ChIP assays were performed. All hematopoietic genes are enriched with H3K4me2 in the multipotential cell population, whereas the distribution was restricted in erythroid and lymphoid cells in a lineage-specific manner. ChIP enrichment was measured by qPCR at 15 hematopoietic promoters that are organized according to their lineage affiliation. The liver-specific promoter albumin was included as a negative control. The experiment was performed in duplicate, and the pattern of H3K4me2 enrichment was reproducible in the replicate (Figure S1). (B) Anti-H3K4me2 ChIP assays were performed on FACS-purified undifferentiated and erythroid-differentiated EML cells. All hematopoietic genes are enriched with H3K4me2 in the undifferentiated cells. However, the enrichment of nonerythroid promoters is substantially reduced following differentiation, while enrichment of the erythroid promoters is augmented. Experiments performed in triplicate; error bars depict SEM. (c) Genome-wide location analysis. Three sets of lineage-specific genes (21 erythroid, 16 myeloid, and 23 lymphoid) were identified from the literature. The spatial distribution of mean H3K4me2 enrichment in U-EMLs (green) and E-EMLs (red) is plotted for the three sets of lineage-specific genes, as well as a set on nonhematopoietic lineage-specific genes (blue in U-EML and black in E-EML), across the 5 kb promoter region on the microarrays. All three sets of lineage-specific genes display H3K4me2 enrichment in the U-EML cells. Following erythroid differentiation, the enrichment in myeloid and lymphoid genes is lost, while the enrichment of the erythroid genes is augmented.
Figure 2.
Figure 2.. H3K4me2+/me3 Genes Are Developmentally Regulated and Transcriptionally Inactive
(A) H3K4me2 (x axis) and H3K4me3 (y axis) enrichment values in U-EML were determined by ChIP-chip and displayed as a scatterplot. H3K4me2+/me3+ andH3K4me2−/me3+ genes comprise the two dominant gene populations. There is an additional population of H3K4me2+/me3 (bottom right) genes but very few of the reciprocal population (H3K4me2−/me3+; upper left). (B) The set of genes that loses H3K4me2 upon erythroid differentiation (red) was marked on the plot from (A), revealing that the set of developmentally regulated genes is strongly overrepresented in the me2+/me3− subset. (C) The set of genes that were H3K4me2+/me3 (within dashed red box) in U-EML cells are highlighted in red in this scatterplot depicting the H3K4me2 versus H3K4me3 state of genes following erythroid differentiation (in E-EML). The large majority of genes are demethylated at H3K4, becoming H3K4me2−/me3−. A minority of genes remain H3K4me2+/me3−, and even fewer become H3K4me2+/me3+. Those that become me2+/me3+ are transcriptionally activated (see [F]). (D) The U-EML H3K4me2 versus H3K4me3 scatterplot in (A) was color coded with each gene’s Affymetrix expression value, with green reflecting the lowest values and red the highest. (E) The mean and median expression values and the percentage of “Present” genes are depicted for the H3K4me2−/me3−, H3K4me2+/me3−, and H3K4me2+/ me3+ gene sets. (F) The mean Affymetrix expression values in U-EML and E-EML are provided for the set of poised genes (H3K4me2+/me3− in U-EML) that gain H3K4me3 following erythroid differentiation (H3K4me2+/me3+ in E-EML). Error bars depict SEM.
Figure 3.
Figure 3.. H3K4me2 Is TSS Independent in Poised Genes and Largely TSS Dependent in Active Genes
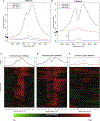
(A) The spatial distribution of H3K4me3 enrichment in U-EMLs is plotted for the three subsets of genes across the 7 kb region on the microarrays. The TSS is located in the center of the 7 kb region (vertical dashed line). While the enrichment at active genes (black line) is localized within the immediate vicinity of the TSS, there is little enrichment at poised and inactive genes. As the distance from the TSS increases, the enrichment of active genes drops to the enrichment level of the inactive genes (arrow). (B) The spatial distribution of the average H3K4me2 enrichment is plotted as for H3K4me3 in (A). H3K4me2 enrichment (red line) is TSS independent at poised genes (H3K4me2+/me3−). Active genes (H3K4me2+/me3+, black line) show increased H3K4me2 enrichment in the proximity of the TSS. Interestingly, at the 5’ and 3’ extremes, H3K4me2 enrichment drops down to the level seen in poised genes. Note the region between the poised genes and the inactive genes (blue line) that comprises the “baseline” enrichment (*). (C) The H3K4me3 profile was generated for each active (me2+/me3+) gene by averaging the values in 700 bp windows across the 7 kb region, and the resulting profiles were hierarchically clustered. The distribution of H3K4me3 in the active genes is homogeneous. (D) The H3K4me2 enrichment of the set of active genes was analyzed as in (C). This pattern reveals largely TSS-focused enrichment of H3K4me2 but somewhat less homogeneous than in H3k4me3. (E) The H3K4me2 enrichment of the set of poised genes (me2+/me3−) was analyzed as in (C). Note the heterogeneous and apparently random pattern of H3K4me2 distribution in this set of genes.
Figure 4.
Figure 4.. Known and Putative Transcription Factor Binding Motifs Correlate with H3K4me2 Distribution in Poised Genes
(A) The consensus motifs for Runx1 and Pu.1 are overrepresented within regions of H3K4me2 enrichment in poised genes. (B) A de novo motif-finding algorithm identified primary sequence motifs that were overrepresented in the same regions of the poised genes as in the ChIP-chip analyses. Two of these motifs were found to be overrepresented within H3K4me2 domains within these genes. Motif 1 appears to be an Ets consensus binding site, while the identity of the factor(s) that binds to motif 2 is unknown. (C) Experimentally obtained Pu.1-binding sites in U-EML cells correlate with H3K4me2 enrichment at poised genes (p < 10−16).
Figure 5.
Figure 5.. H3K4 Methylation State Correlates with the Presence of CpG Islands
(A) The distribution of CGI (left) and non-CGI (right) genes (orange) is superimposed on the H3K4me2 versus H3K4me3 scatterplot of all genes (gray) from U-EML cells. The patterns of H3K4 methylation are different in the two cases, with the majority of CGI genes in the me2+/me3+ quadrant and the majority of non-CGI genes in the me2−/me3− quadrant. CGI genes are depleted from the set of poised genes, while non-CGI genes are highly enriched in this set. (B) The proportion of H3K4me2+ genes that are poised (H3K4me2+/me3−) is strongly correlated with CGI status.
Figure 6.
Figure 6.. In ES Cells, the Distribution of H3K4me2 among Hematopoietic Genes Is Strongly Correlated with CGI Status and Not Developmental Potential
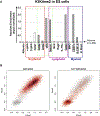
(A) The enrichment of H3K4me2 at the lineage-specific hematopoietic promoters was determined in murine ES cells. Although these cells clearly have hematopoietic potential, half of the hematopoietic genes lacked H3K4me2. Enrichment of H3K4me2 was more highly correlated with the presence of CpG islands (gray bars), with enrichment found at 7 of 7 CGI but only 1 of 9 non-CGI genes (white bars). The dashed line depicts the enrichment of albumin in H3K4me2 ChIP assays performed in parallel on U-EML cells. (B) The genome-wide distribution of H3K4me2 and H3K4me3 is very highly correlated with CGI status in undifferentiated mES cells. Note the complete absence of the poised gene population (H3K4me2+/me3−) in these cells.
Figure 7.
Figure 7.. A Proposed Model of the Developmental Regulation of H3K4 Methylation at CGI and Non-CGI Genes throughout Development
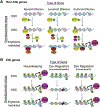
(A) The distribution of H3K4me2 and H3K4me3 is tightly linked to CGIs in undifferentiated ES cells. Non-CGI genes, including hematopoietic lineage-restricted genes, lack these marks at the earliest stages of embryonic development. By the time cells have acquired hematopoietic specification, lineage-specific non-CGI genes become poised for expression by the association of critical regulators of hematopoietic development, such as Runx1, Pu.1, Gata2, or Scl (hematopoietic transcription factors [HTFs]). These factors induce localized, TSS-independent deposition of H3K4me2. Upon final lineage specification and differentiation, lineage-specific TFs (e.g., the erythroid-specific TF [ETF] Gata1) induce changes in both erythroid and nonerythroid genes. Nonerythroid genes lose H3K4me2, likely through the recruitment or activation of histone demethylases (HD), effectively committing the developing cells to the erythroid lineage, while erythroid genes become transcriptionally activated and acquire TSS-targeted H3K4me2/3. (B) Conversely, CGI genes are all marked by H3K4me2/me3 in undifferentiated ES cells. However, many of these genes are not expressed, due, in part, to the concomitant association of H3K27me3 (data not shown). The activation state of a large proportion of CGI genes is not affected by development because these genes are involved in housekeeping functions required in all cells. However, the subset of developmental regulatory genes are gradually inactivated, potentially by DNA methylation of the CGIs (red boxes), in order to prevent the misexpression of these powerful developmental modulators.

Similar articles

Cited by

References

    1. Ayton PM, Chen EH, and Cleary ML (2004). Binding to nonmethylated CpG DNA is essential for target recognition, transactivation, and myeloid transformation by an MLL oncoprotein. Mol. Cell. Biol 24, 10470–10478. - PMC - PubMed
    1. Bernstein BE, Kamal M, Lindblad-Toh K, Bekiranov S, Bailey DK, Huebert DJ, McMahon S, Karlsson EK, Kulbokas EJ 3rd, Gingeras TR, et al. (2005). Genomic maps and comparative analysis of histone modifications in human and mouse. Cell 120, 169–181. - PubMed
    1. Bernstein BE, Mikkelsen TS, Xie X, Kamal M, Huebert DJ, Cuff J, Fry B, Meissner A, Wernig M, Plath K, et al. (2006). A bivalent chromatin structure marks key developmental genes in embryonic stem cells. Cell 125, 315–326. - PubMed
    1. Fischle W, Wang Y, and Allis CD (2003). Histone and chromatin cross-talk. Curr. Opin. Cell Biol 15, 172–183. - PubMed
    1. Fisher AG (2002). Cellular identity and lineage choice. Nat. Rev. Immunol 2, 977–982. - PubMed

Publication types

MeSH terms