Proteomic profiling of endothelin-1-stimulated hypertrophic cardiomyocytes reveals the increase of four different desmin species and alpha-B-crystallin
- PMID: 18472024
- PMCID: PMC2905868
- DOI: 10.1016/j.bbapap.2008.04.003
Proteomic profiling of endothelin-1-stimulated hypertrophic cardiomyocytes reveals the increase of four different desmin species and alpha-B-crystallin
Abstract
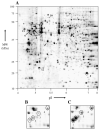
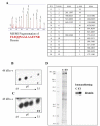
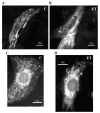
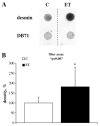
We performed a proteomic investigation on primary cultures of neonatal rat cardiomyocytes after treatment with 10 nM endothelin-1 (ET1) for 48 h, an in vitro model for cardiac hypertrophy. Two-dimensional gel electrophoresis profiles of cell lysates were compared after colloidal Coomassie Blue staining. 12 protein spots that significantly changed in density due to ET1 stimulation were selected for in-gel digestion and identified through mass spectrometry. Of these, 8 spots were increased and 4 were decreased. Four of the increased proteins were identified as desmin, the cardiac component of intermediate filaments and one as alpha-B-crystallin, a molecular chaperone that binds desmin. All the desmins increased 2- to 5-fold, and alpha-B-crystallin increased 2-fold after ET1 treatment. Desmin cytoskeleton has been implicated in the regulation of mitochondrial activity and distribution, as well as in the formation of amyloid bodies. Mitochondria-specific fluorescent probe MitoTracker indicated mitochondrial redistribution in hypertrophic cells. An increase of amyloid aggregates containing desmin upon treatment with ET1 was detected by filter assay. Of the four proteins that showed decreased abundance after ET1 treatment, the chaperones hsp60 and grp75 were decreased 13- and 9-fold, respectively. In conclusion, proteomic profiling of ET1-stimulated rat neonatal cardiomyocytes reveals specific changes in cardiac molecular phenotype mainly involving intermediate filament and molecular chaperone proteins.
Figures


Similar articles
-
Proteomic analysis reveals different protein changes during endothelin-1- or leukemic inhibitory factor-induced hypertrophy of cardiomyocytes in vitro.Mol Cell Proteomics. 2005 May;4(5):651-61. doi: 10.1074/mcp.M400155-MCP200. Epub 2005 Feb 11. Mol Cell Proteomics. 2005. PMID: 15708983
-
Muscle creatine kinase deficiency triggers both actin depolymerization and desmin disorganization by advanced glycation end products in dilated cardiomyopathy.J Biol Chem. 2011 Oct 7;286(40):35007-19. doi: 10.1074/jbc.M111.252395. Epub 2011 Jul 17. J Biol Chem. 2011. PMID: 21768101 Free PMC article.
-
Expression of R120G-alphaB-crystallin causes aberrant desmin and alphaB-crystallin aggregation and cardiomyopathy in mice.Circ Res. 2001 Jul 6;89(1):84-91. doi: 10.1161/hh1301.092688. Circ Res. 2001. PMID: 11440982
-
Glucocorticoid treatment induces expression of small heat shock proteins in human satellite cell populations: consequences for a desmin-related myopathy involving the R120G alpha B-crystallin mutation.Neuromuscul Disord. 2002 Jun;12(5):457-65. doi: 10.1016/s0960-8966(01)00306-6. Neuromuscul Disord. 2002. PMID: 12031619
-
Molecular mechanisms of α-crystallinopathy and its therapeutic strategy.Biol Pharm Bull. 2011;34(11):1653-8. doi: 10.1248/bpb.34.1653. Biol Pharm Bull. 2011. PMID: 22040875 Review.
Cited by
-
Is Desmin Propensity to Aggregate Part of its Protective Function?Cells. 2020 Feb 20;9(2):491. doi: 10.3390/cells9020491. Cells. 2020. PMID: 32093415 Free PMC article. Review.
-
Desmin modifications associate with amyloid-like oligomers deposition in heart failure.Cardiovasc Res. 2014 Apr 1;102(1):24-34. doi: 10.1093/cvr/cvu003. Epub 2014 Jan 9. Cardiovasc Res. 2014. PMID: 24413773 Free PMC article.
-
Protein post-translational modifications and misfolding: new concepts in heart failure.Proteomics Clin Appl. 2014 Aug;8(7-8):534-42. doi: 10.1002/prca.201400037. Proteomics Clin Appl. 2014. PMID: 24946239 Free PMC article. Review.
-
Right ventricular protein expression profile in end-stage heart failure.Pulm Circ. 2015 Sep;5(3):481-97. doi: 10.1086/682219. Pulm Circ. 2015. PMID: 26401249 Free PMC article.
-
Increased level of phosphorylated desmin and its degradation products in heart failure.Biochem Biophys Rep. 2016 Feb 27;6:54-62. doi: 10.1016/j.bbrep.2016.02.014. eCollection 2016 Jul. Biochem Biophys Rep. 2016. PMID: 28955862 Free PMC article.
References
-
- Lorell BH, Carabello BA. Left ventricular hypertrophy: pathogenesis, detection, and prognosis. Circulation. 2000;102:470–479. - PubMed
-
- Houser SR, Lakatta EG. Function of the cardiac myocyte in the conundrum of end-stage, dilated human heart failure. Circulation. 1999;99:600–604. - PubMed
-
- Hunter JJ, Chien KR. Signaling pathways for cardiac hypertrophy and failure. N. Engl. J. Med. 1999;341:1276–1283. - PubMed
-
- Brancaccio M, Fratta L, Notte A, Hirsch E, Poulet R, Guazzone S, De Acetis M, Vecchione C, Marino G, Altruda F, Silengo L, Tarone G, Lembo G. Melusin, a muscle-specific integrin beta1-interacting protein, is required to prevent cardiac failure in response to chronic pressure overload. Nat. Med. 2003;9:68–75. - PubMed
Publication types
MeSH terms
Substances
Grants and funding
LinkOut - more resources
Full Text Sources
Other Literature Sources
Research Materials
Miscellaneous

