

Comprehensive identification of PIP3-regulated PH domains from C. elegans to H. sapiens by model prediction and live imaging
- PMID: 18471983
- PMCID: PMC3523718
- DOI: 10.1016/j.molcel.2008.04.008
Comprehensive identification of PIP3-regulated PH domains from C. elegans to H. sapiens by model prediction and live imaging
Abstract
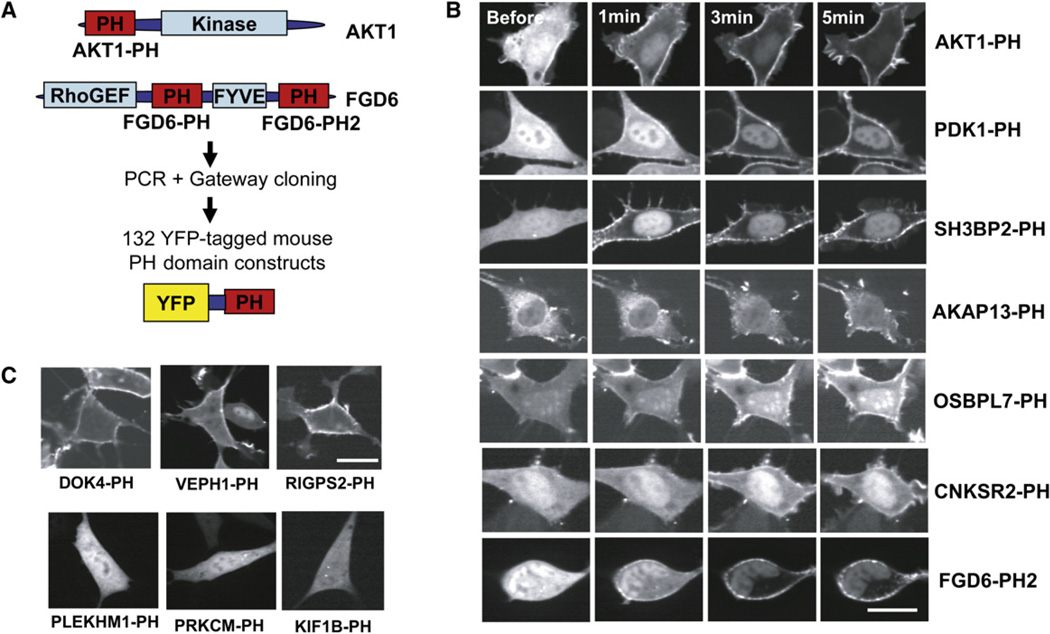
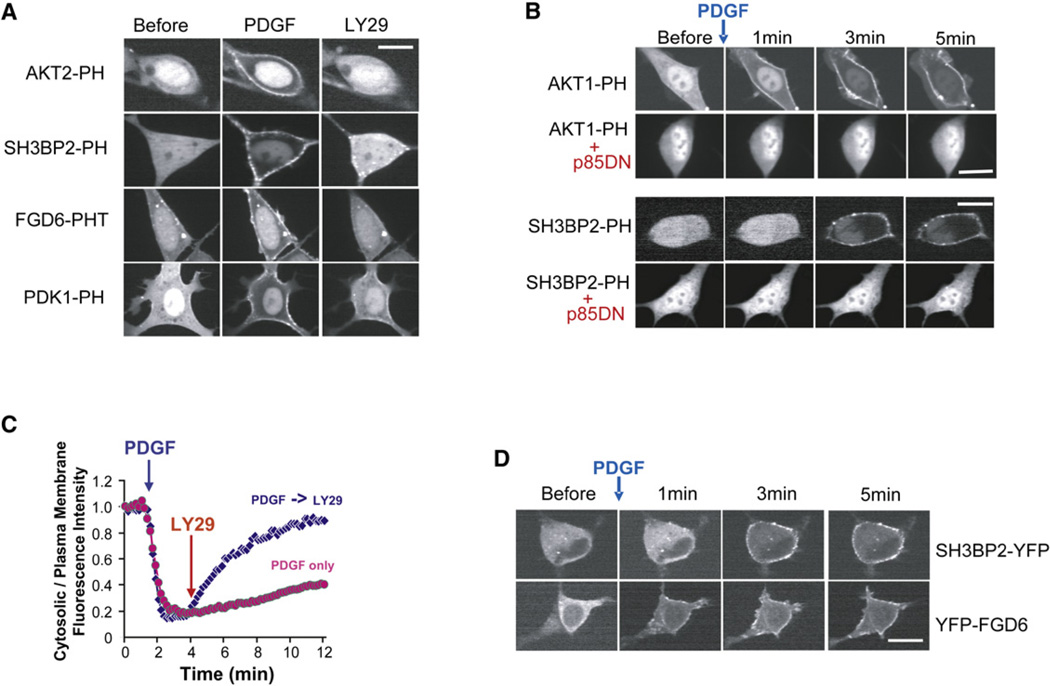
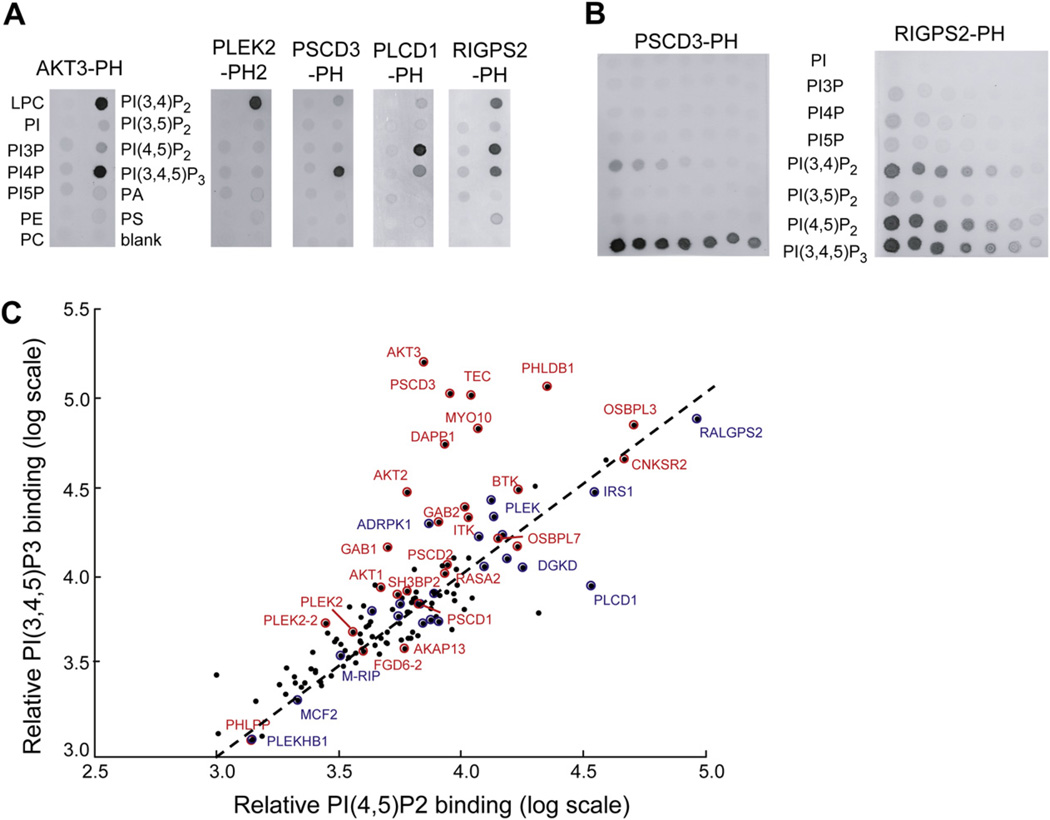
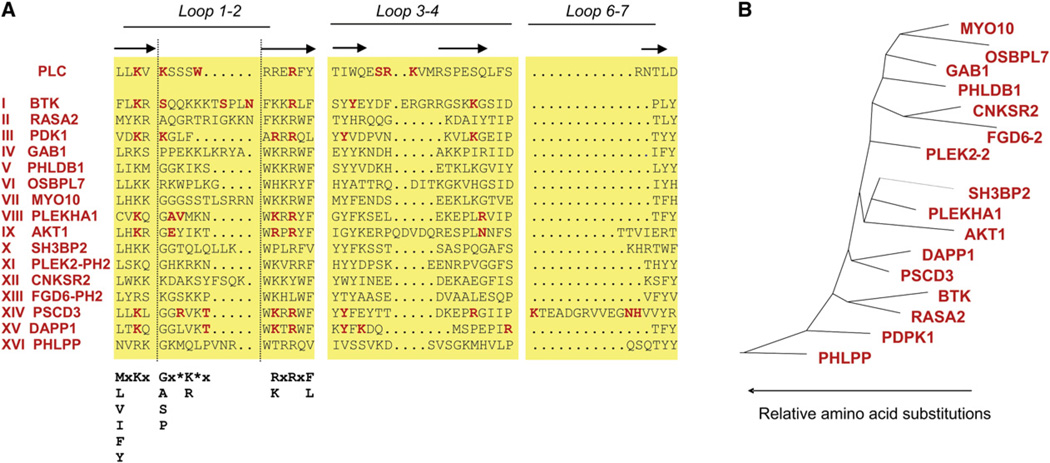
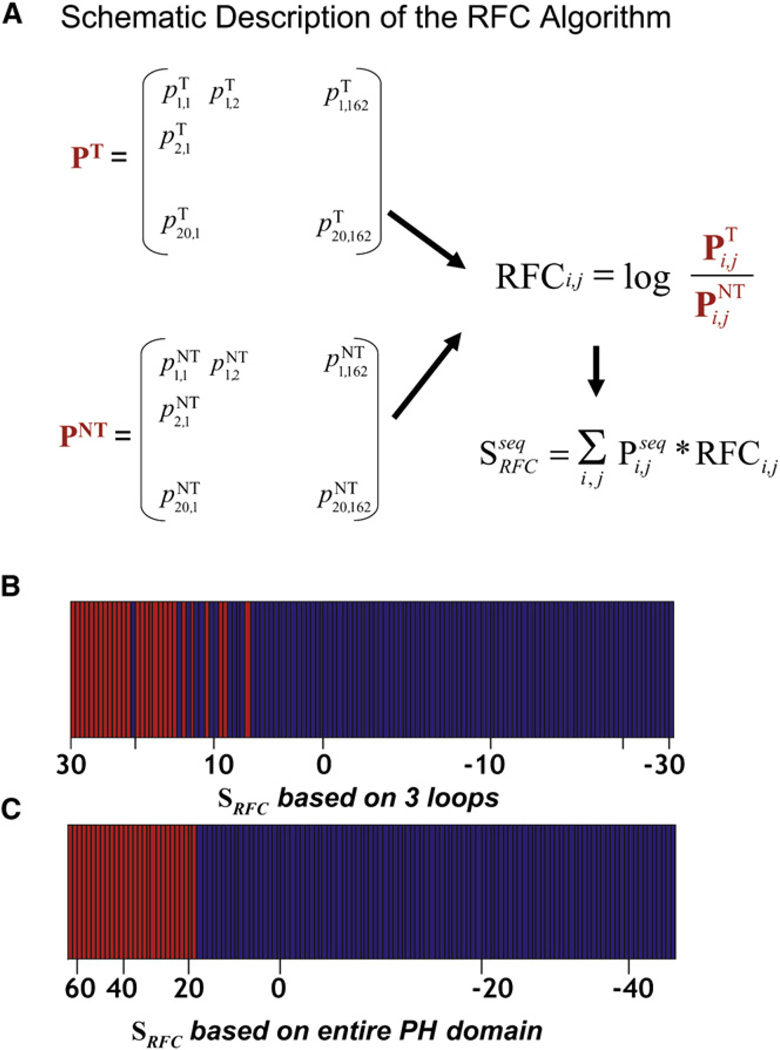
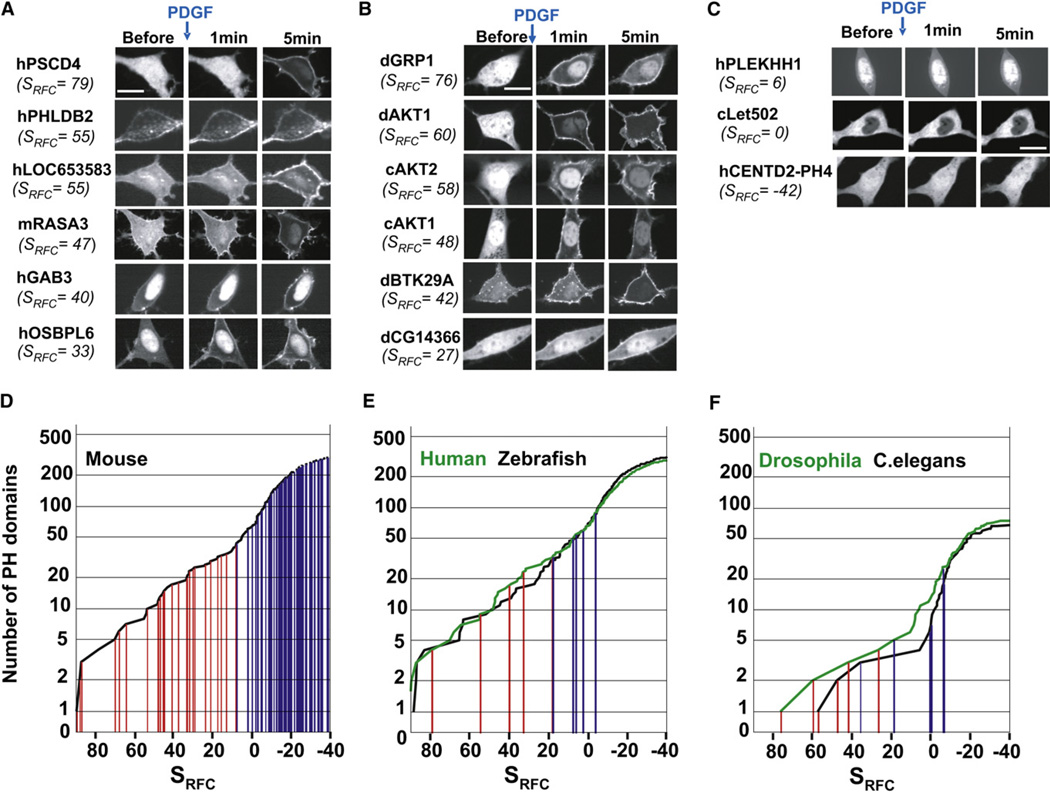
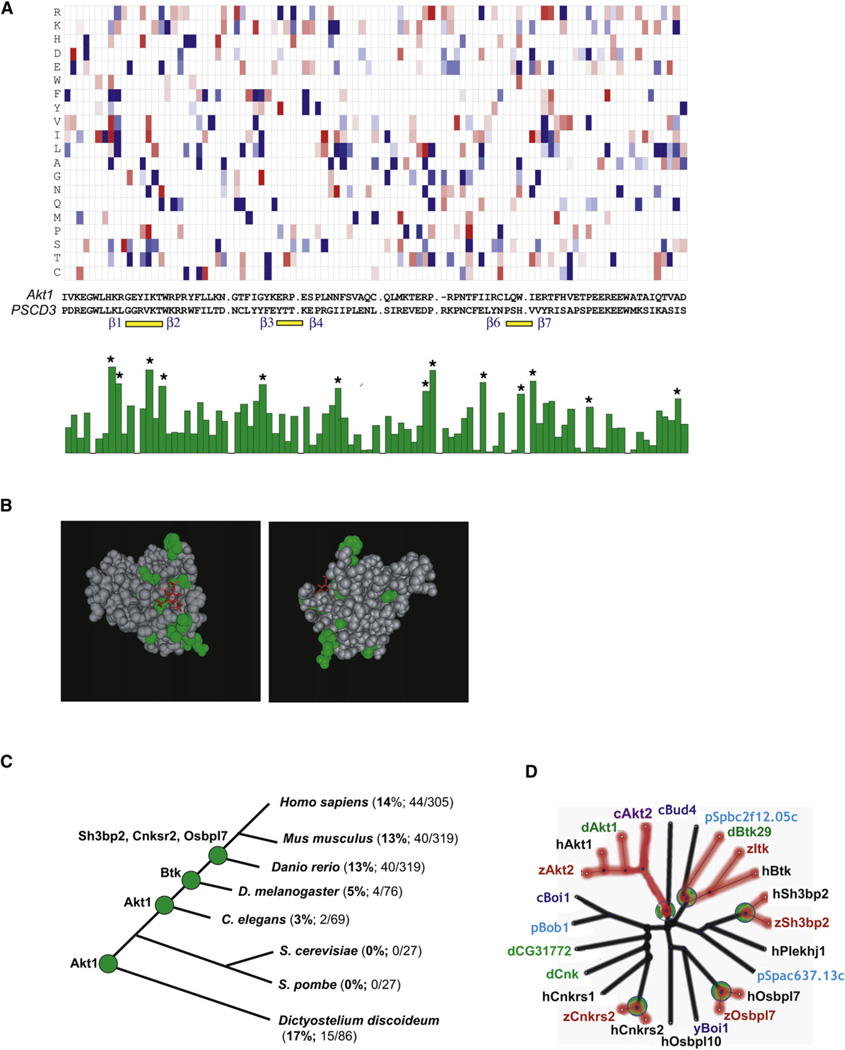
Phosphoinositide 3-kinase (PI3K) and its product phosphatidylinositol(3,4,5)-trisphosphate (PIP3) control cell growth, migration, and other processes by recruiting proteins with pleckstrin homology (PH) domains and possibly other domains to the plasma membrane (PM). However, previous experimental and structural work with PH domains left conflicting evidence about which ones are PIP3 regulated. Here we used live-cell confocal imaging of 130 YFP-conjugated mouse PH domains and found that 20% translocated to the PM in response to receptor-generated PIP3 production. We developed a recursive-learning algorithm to predict PIP3 regulation of 1200 PH domains from different eukaryotes and validated that it accurately predicts PIP3 regulation. Strikingly, this algorithm showed that PIP3 regulation is specified by amino acids across the PH domain, not just the PIP3-binding pocket, and must have evolved several times independently from PIP3-insensitive ancestral PH domains. Finally, our algorithm and live-cell experiments provide a functional survey of PH domains in different species, showing that PI3K regulation increased from approximately two C. elegans and four Drosophila to 40 vertebrate proteins.
Figures
Similar articles
-
PIP3-binding proteins promote age-dependent protein aggregation and limit survival in C. elegans.Oncotarget. 2016 Aug 2;7(31):48870-48886. doi: 10.18632/oncotarget.10549. Oncotarget. 2016. PMID: 27429199 Free PMC article.
-
Signal propagation from membrane messengers to nuclear effectors revealed by reporters of phosphoinositide dynamics and Akt activity.Proc Natl Acad Sci U S A. 2005 Oct 18;102(42):15081-6. doi: 10.1073/pnas.0502889102. Epub 2005 Oct 7. Proc Natl Acad Sci U S A. 2005. PMID: 16214892 Free PMC article.
-
Selective cellular effects of overexpressed pleckstrin-homology domains that recognize PtdIns(3,4,5)P3 suggest their interaction with protein binding partners.J Cell Sci. 2005 Oct 15;118(Pt 20):4879-88. doi: 10.1242/jcs.02606. J Cell Sci. 2005. PMID: 16219693
-
Phosphatidylinositol (3,4) bisphosphate-specific phosphatases and effector proteins: A distinct branch of PI3K signaling.Cell Signal. 2015 Sep;27(9):1789-98. doi: 10.1016/j.cellsig.2015.05.013. Epub 2015 May 27. Cell Signal. 2015. PMID: 26022180 Review.
-
Phosphatidylinositol-3,4,5-trisphosphate: tool of choice for class I PI 3-kinases.Bioessays. 2013 Jul;35(7):602-11. doi: 10.1002/bies.201200176. Bioessays. 2013. PMID: 23765576 Free PMC article. Review.
Cited by
-
Phosphatidylinositol(4,5)bisphosphate: diverse functions at the plasma membrane.Essays Biochem. 2020 Sep 23;64(3):513-531. doi: 10.1042/EBC20200041. Essays Biochem. 2020. PMID: 32844214 Free PMC article. Review.
-
PPIP5K1 modulates ligand competition between diphosphoinositol polyphosphates and PtdIns(3,4,5)P3 for polyphosphoinositide-binding domains.Biochem J. 2013 Aug 1;453(3):413-26. doi: 10.1042/BJ20121528. Biochem J. 2013. PMID: 23682967 Free PMC article.
-
Filopodia and adhesion in cancer cell motility.Cell Adh Migr. 2011 Sep-Oct;5(5):421-30. doi: 10.4161/cam.5.5.17723. Cell Adh Migr. 2011. PMID: 21975551 Free PMC article. Review.
-
Detection and manipulation of phosphoinositides.Biochim Biophys Acta. 2015 Jun;1851(6):736-45. doi: 10.1016/j.bbalip.2014.12.008. Epub 2014 Dec 13. Biochim Biophys Acta. 2015. PMID: 25514766 Free PMC article. Review.
-
Membrane and Protein Interactions of the Pleckstrin Homology Domain Superfamily.Membranes (Basel). 2015 Oct 23;5(4):646-63. doi: 10.3390/membranes5040646. Membranes (Basel). 2015. PMID: 26512702 Free PMC article.
References
-
- Allam A, Marshall AJ. Role of the adaptor proteins Bam32, TAPP1 and TAPP2 in lymphocyte activation. Immunol. Lett. 2005;97:7–17. - PubMed
-
- Bottomley JR, Reynolds JS, Lockyer PJ, Cullen PJ. Structural and functional analysis of the putative inositol 1,3,4,5-tetrakisphosphate receptors GAP1(IP4BP) and GAP1(m) Biochem. Biophys. Res. Commun. 1998;250:143–149. - PubMed
Publication types
MeSH terms
Substances
Grants and funding
LinkOut - more resources
Full Text Sources
Other Literature Sources
