. 2008 May 7;28(19):4878-87.
doi: 10.1523/JNEUROSCI.0828-08.2008.

Dicer inactivation leads to progressive functional and structural degeneration of the mouse retina

Affiliations

Dicer inactivation leads to progressive functional and structural degeneration of the mouse retina

Devid Damiani et al. J Neurosci. .

Abstract

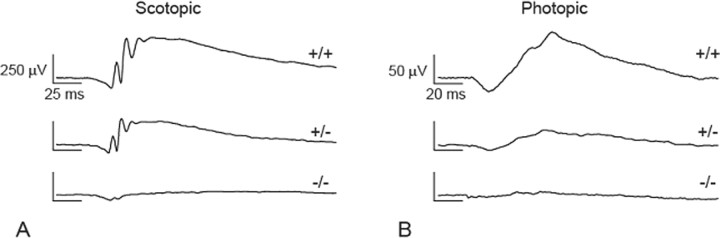
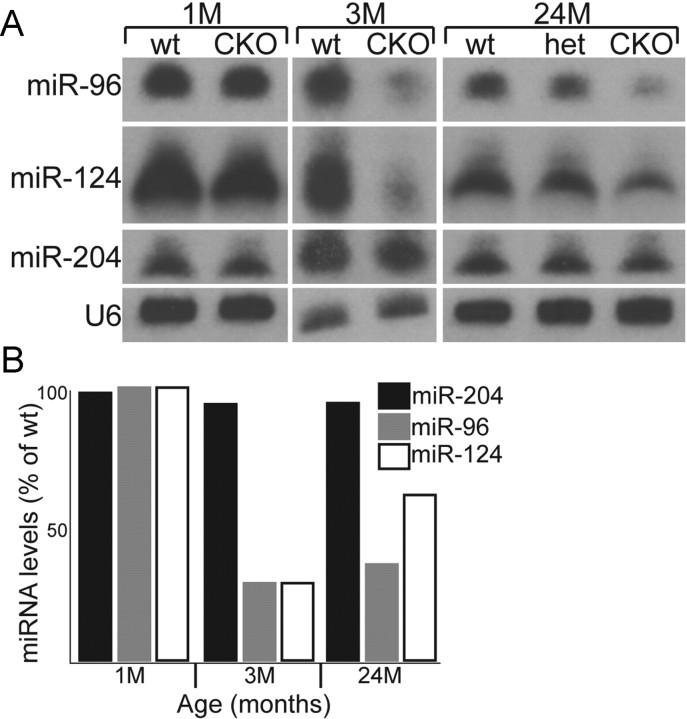
MicroRNAs (miRNAs) are small, highly conserved molecules that have been shown to regulate the expression of genes by binding to specific target mRNAs. Dicer, an RNase III endonuclease, is essential for the production and function of mature miRNAs, and removal of Dicer has been shown to disrupt many developmental processes. In this study, Dicer was removed specifically from the retina using a floxed Dicer conditional allele and the retinal Chx10Cre transgene. Retinal Dicer knock-out mice displayed a reproducible inability to respond to light. In addition, morphological defects were observed with the formation of photoreceptor rosettes at postnatal day 16, which progressed to more general cellular disorganization and widespread degeneration of retinal cell types as the animals aged. This was accompanied by concomitant decrease in both scotopic and photopic electroretinogram (ERG) responses. Interestingly, removing a single allele of Dicer resulted in ERG deficits throughout life but not to morphological abnormalities. Northern blot analysis of Dicer-depleted retinas showed a decrease in several miRNAs. The observation that progressive retinal degeneration occurred after removal of Dicer raises the possibility that miRNAs are involved in retinal neurodegenerative disorders.


Figures

Figure 1.
Figure 1.
Representative scotopic (A) and corresponding photopic (B) ERG traces recorded at 5 months of age from wild-type, Dicer CKO heterozygous (+/−), and Dicer CKO homozygous (−/−) mice. Traces from each strain were similar at all time points analyzed.
Figure 2.
Figure 2.
Average maximum scotopic a- and b-wave (A) and photopic b-wave (B) amplitudes for wild-type (WT), Dicer +/−, and Dicer −/− eyes. A, Scotopic values for Dicer +/− and Dicer −/− at 1, 3, and 5 months differed from wild type and each other, with the exception of the 1 month a-wave value for the Dicer +/−. B, Photopic values for Dicer +/− and Dicer −/− eyes at 1, 3, and 5 months differed from wild type and each other, with the exception of the 5 month b-wave value between the Dicer +/− and Dicer −/−. Different sets of mice were recorded at 1, 3, and 5 months, because the mice were killed the day after ERG for morphological studies. Error bars indicate SEM. M, Month.
Figure 3.
Figure 3.
In situ hybridization for Dicer in wild-type (A) and CKO (B) retinas at P16. A, In the wild-type animal, virtually all retinal cell types were labeled. Photoreceptor staining was concentrated within the inner segments (is; arrows) that contain the protein synthetic machinery, whereas the outer nuclear layer (onl), mostly containing their nuclei, was devoid of staining. The cytoplasm of cells of the inner nuclear layer (inl) and ganglion cell layer (gcl) also showed intense Dicer expression. B, In the CKO, expression was more patchy than in the wild type. Most photoreceptors were negative, whereas cells in the gcl were either very intensely or relatively weakly stained (arrows). The inset shows a high magnification of the stained cells in the gcl. Arrows point to the somas of two negative cells adjacent to a larger cell, darkly stained (asterisk), all presumably ganglion cells. ipl, Inner plexiform layers.
Figure 4.
Figure 4.
A, Immunofluorescence staining with Cre antibodies in the CKO retina showing patchy expression of the transgene. B, Patchy expression was also observed in the wild-type retina. Cre-negative cells (within the brackets) alternated with Cre-positive, fluorescent nuclei in the inner nuclear layer at the presumptive location of bipolar cells. C, Immunostaining for Cre (green) and PKCα (red) for rod bipolar cells. With few exceptions, rod bipolar cells were Cre positive. onl, Outer nuclear layer; opl, outer plexiform layer; inl, inner nuclear layer; ipl, inner plexiform layer.
Figure 5.
Figure 5.
Northern blot analysis of mature miRNA levels from retinal homogenates of wild-type (wt), heterozygous (het), and mutant animals. A, Northern blot analysis of equal amounts of RNA obtained from pooled samples of wild-type, mutant, and, at the 24 month time point, heterozygous retinas (see Materials and Methods). The small RNA U6 was used as a loading control. B, Histogram of the relative expression levels for each miRNA examined on the Northern blot shown in A. At the 24 month time point, miR-96 and miR-124a were decreased 18 and 10%, respectively, in heterozygous retinas. No decrease in miR-204 expression was observed at any time point examined (see Results). Expression levels were normalized to wild type as described in Materials and Methods. M, Month.
Figure 6.
Figure 6.
Representative rosette in a P16 Dicer CKO retinal section. A, Nuclear staining (blue) demonstrated that the rosette (R) at this stage of development was composed exclusively of photoreceptors (identified by their distinctive nuclear morphology). GFAP staining (red) was limited to astrocytic processes in the ganglion cell layer (arrows), indicating that macroglial reactivity was virtually absent after removal of Dicer. B, Rosettes did not appear to contain Müller cells because the Müller cell-specific enzyme glutamine synthase (green signal) did not colocalize with cells in the rosette. olm, Outer limiting membrane; onl, outer nuclear layer; inl, inner nuclear layer; ipl, inner plexiform layer; gcl, ganglion cell layer.
Figure 7.
Figure 7.
Vertical section of a P16 CKO retina, exhibiting a typical rosette (R), stained with antibodies against Cre (green) and phosphohistone H3 (red) to locate mitotic cells. No dividing (red) cells were visible. As a positive control, the inset shows mitotic cells of the corneal surface (C) from the same ocular section from which the retinal slide was obtained. onl, Outer nuclear layer; inl, inner nuclear layer.
Figure 8.
Figure 8.
Characterization of cell types in the CKO retina. A, Rods and cones, labeled red by recoverin antibody, in a 3-month-old CKO retina; cones are counterstained green with peanut lectin. Their synaptic terminals formed a regular row in the outer plexiform layer, similar to what is observed in a normal retina. B, Horizontal cells, labeled red by calbindin D antibody, formed a tier in the outer part of the inner nuclear layer. Some of these sprouted ectopic neuritis toward the outer retina (arrows). The green signal denotes Cre staining. The section is from a P35 retina. C, Cre-positive nuclei (green) belong mostly to rod bipolar cells, the membranes of which are appropriately labeled red by an antibody against PKCα. The section is from a P45 retina. D, Anti-G0α antibodies (green) label ON-center cone and rod bipolar cells. PKCα antibody labels only rod bipolar cells (red). In this section, orange-yellow cells have been labeled by both antibodies and are therefore rod bipolar cells. Green cells are ON-center cone bipolar cells (CB). Some of these cells (arrow) appeared displaced toward the outer retina at a location adjacent to a photoreceptor rosette. The section is from a P45 retina. E, Cholinergic amacrine cells (ChA; red) are seen in the CKO retina at the expected location. Their cell bodies formed two mirror-symmetric populations (arrows) in the inner nuclear and ganglion cell layers, respectively, whereas their processes formed two bands in the inner plexiform layer, characteristic to what is observed in the normal retina. Blue staining is a nuclear dye. The section is from a P30 retina. R, Rosette. F, Antibodies against the 200 kDa subunit of neurofilaments (red) revealed the axonal arborizations of horizontal cells (HCa) and the somata of large ganglion cells (Gc) in the appropriate retinal layers. Green cells are stained with Cre antibodies. The section is from a P35 retina. Ph, Photoreceptors; onl, outer nuclear layer; opl, outer plexiform layer; ipl, inner plexiform layer; gcl, ganglion cell layer.
Figure 9.
Figure 9.
Progressive retinal remodeling and degeneration in P16–P120 CKO retinas. A, Retinal section from a P16 animal. A large rosette (R) was penetrated by rod bipolar cells, labeled green by PKCα antibodies. These cells contained the normal complement of synaptic proteins, including the glutamate receptor mGluR6 (red). The inset shows at high magnification mGluR6-positive puncta decorating the dendritic tips of rod bipolar cells within a rosette. B, Retinal section from a P30 animal. Three adjacent rosettes (R) are revealed by antibodies against recoverin (red). Blue is nuclear counterstaining. PSD95, a marker of photoreceptor synaptic terminals (green), was mislocalized between the rosettes, indicating displacement of photoreceptor terminals to ectopic locations. Inset, Detail of ectopic expression of PSD95 (green) throughout the width of the outer nuclear layer. C, Concomitant with rosette formation, photoreceptors and second-order neurons were displaced to the outer retina and visibly remodeled in P35 retinas. The highlighted horizontal cell (HC), labeled red by calbindin D, sprouted profusely toward the outer retina (arrows), whereas the cell body migrated from the inner to the outer nuclear layer. The green stain is anti-Cre and thus denotes cells that are null for the Dicer protein. D, At late stages, photoreceptors and inner retinal layers degenerated. Only three to five rows of photoreceptor nuclei remained in the outer nuclear layer of this 5-month-old retina. Rod bipolar cells, stained with PKCα (red), were scant and showed poorly preserved dendritic arborizations. These cells were Cre negative. A few Cre-positive cells (labeled green by anti-Cre antibodies) persisted in the inner nuclear layer (arrows). E, In this large rosette (R) from a P45 retina, retinal layering was profoundly altered. Both rod and cone bipolar cells (stained red by PKCα and green by Goα antibodies) were present in the rosette and were found at ectopic retinal locations. Double-labeled cells (yellow) are rod bipolars, labeled by both antibodies. Scale bar in E applies also to A–D. F, Glial activation accompanied retinal degeneration in 3-month-old CKO retinas. In this image, Müller glial cells (Mc) were stained both by glutamine synthase (green) and GFAP antibodies (red). The latter demonstrates that glial activation was widespread. Note the decrement in the number of photoreceptor rows to 2–5 from the 12–14 of a normal retina. onl, Outer nuclear layer; opl, outer plexiform layer; inl, inner nuclear layer.
Figure 10.
Figure 10.
A, Extensive degeneration of the CKO retina at 5 months of age. Nuclei are stained blue by a fluorescent DNA-binding molecule. B, Compared with an age-matched, wild-type retina, all the layers of the CKO appeared thinner. Rod bipolar cells, labeled red by PKCα antibody, were significantly reduced in number and displayed only rare and disorganized dendrites compared with their counterpart in the wild-type retina. Surviving rod bipolar cells in the CKO were primarily Cre negative, whereas the number of Cre-positive cells (green labeling) was much decreased compared with the wild-type retina. Pyknotic nuclei, indicative of apoptotis, were visible in the outer nuclear layer (arrows) and in the inner nuclear layer (arrowhead) of the CKO retina. C, Retinal section from a heterozygous animal, stained as the preparations shown in A and B. No evident alterations of the morphology were detectable in heterozygous individuals. onl, Outer nuclear layer; opl, outer plexiform layer; inl, inner nuclear layer; ipl, inner plexiform layer; gcl, ganglion cell layer.

Similar articles

Cited by

References

    1. Ambros V. MicroRNA pathways in flies and worms: growth, death, fat, stress, and timing. Cell. 2003;113:673–676. - PubMed
    1. Ambros V, Chen X. The regulation of genes and genomes by small RNAs. Development. 2007;134:1635–1641. - PubMed
    1. Babak T, Zhang W, Morris Q, Blencowe BJ, Hughes TR. Probing microRNAs with microarrays: tissue specificity and functional inference. RNA. 2004;10:1813–1819. - PMC - PubMed
    1. Barad O, Meiri E, Avniel A, Aharonov R, Barzilai A, Bentwich I, Einav U, Gilad S, Hurban P, Karov Y, Lobenhofer EK, Sharon E, Shiboleth YM, Shtutman M, Bentwich Z, Einat P. MicroRNA expression detected by oligonucleotide microarrays: system establishment and expression profiling in human tissues. Genome Res. 2004;14:2486–2494. - PMC - PubMed
    1. Bernstein E, Kim SY, Carmell MA, Murchison EP, Alcorn H, Li MZ, Mills AA, Elledge SJ, Anderson KV, Hannon GJ. Dicer is essential for mouse development. Nat Genet. 2003;35:215–217. - PubMed

Publication types

MeSH terms

LinkOut - more resources