Imaging cyclic AMP changes in pancreatic islets of transgenic reporter mice
- PMID: 18461145
- PMCID: PMC2330161
- DOI: 10.1371/journal.pone.0002127
Imaging cyclic AMP changes in pancreatic islets of transgenic reporter mice
Abstract
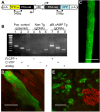
Cyclic AMP (cAMP) and Ca(2+) are two ubiquitous second messengers in transduction pathways downstream of receptors for hormones, neurotransmitters and local signals. The availability of fluorescent Ca(2+) reporter dyes that are easily introduced into cells and tissues has facilitated analysis of the dynamics and spatial patterns for Ca(2+) signaling pathways. A similar dissection of the role of cAMP has lagged because indicator dyes do not exist. Genetically encoded reporters for cAMP are available but they must be introduced by transient transfection in cell culture, which limits their utility. We report here that we have produced a strain of transgenic mice in which an enhanced cAMP reporter is integrated in the genome and can be expressed in any targeted tissue and with tetracycline induction. We have expressed the cAMP reporter in beta-cells of pancreatic islets and conducted an analysis of intracellular cAMP levels in relation to glucose stimulation, Ca(2+) levels, and membrane depolarization. Pancreatic function in transgenic mice was normal. In induced transgenic islets, glucose evoked an increase in cAMP in beta-cells in a dose-dependent manner. The cAMP response is independent of (in fact, precedes) the Ca(2+) influx that results from glucose stimulation of islets. Glucose-evoked cAMP responses are synchronous in cells throughout the islet and occur in 2 phases suggestive of the time course of insulin secretion. Insofar as cAMP in islets is known to potentiate insulin secretion, the novel transgenic mouse model will for the first time permit detailed analyses of cAMP signals in beta-cells within islets, i.e. in their native physiological context. Reporter expression in other tissues (such as the heart) where cAMP plays a critical regulatory role, will permit novel biomedical approaches.
Conflict of interest statement
Figures


Similar articles
-
Cyclic AMP signaling in pancreatic islets.Adv Exp Med Biol. 2010;654:281-304. doi: 10.1007/978-90-481-3271-3_13. Adv Exp Med Biol. 2010. PMID: 20217503 Review.
-
Constitutively active stimulatory G-protein alpha s in beta-cells of transgenic mice causes counterregulation of the increased adenosine 3',5'-monophosphate and insulin secretion.Endocrinology. 1994 Jan;134(1):42-7. doi: 10.1210/endo.134.1.7506212. Endocrinology. 1994. PMID: 7506212
-
cAMP-mediated and metabolic amplification of insulin secretion are distinct pathways sharing independence of β-cell microfilaments.Endocrinology. 2012 Oct;153(10):4644-54. doi: 10.1210/en.2012-1450. Epub 2012 Sep 4. Endocrinology. 2012. PMID: 22948217
-
cAMP-mediated signaling normalizes glucose-stimulated insulin secretion in uncoupling protein-2 overexpressing beta-cells.J Endocrinol. 2006 Sep;190(3):669-80. doi: 10.1677/joe.1.06723. J Endocrinol. 2006. PMID: 17003268
-
Signaling elements involved in the metabolic regulation of mTOR by nutrients, incretins, and growth factors in islets.Diabetes. 2004 Dec;53 Suppl 3:S225-32. doi: 10.2337/diabetes.53.suppl_3.s225. Diabetes. 2004. PMID: 15561916 Review.
Cited by
-
From Isles of Königsberg to Islets of Langerhans: Examining the Function of the Endocrine Pancreas Through Network Science.Front Endocrinol (Lausanne). 2022 Jun 15;13:922640. doi: 10.3389/fendo.2022.922640. eCollection 2022. Front Endocrinol (Lausanne). 2022. PMID: 35784543 Free PMC article. Review.
-
Cyclic AMP dynamics in the pancreatic β-cell.Ups J Med Sci. 2012 Nov;117(4):355-69. doi: 10.3109/03009734.2012.724732. Epub 2012 Sep 13. Ups J Med Sci. 2012. PMID: 22970724 Free PMC article. Review.
-
Glucose-induced cAMP elevation in β-cells involves amplification of constitutive and glucagon-activated GLP-1 receptor signalling.Acta Physiol (Oxf). 2021 Apr;231(4):e13611. doi: 10.1111/apha.13611. Epub 2021 Jan 9. Acta Physiol (Oxf). 2021. PMID: 33369112 Free PMC article.
-
Noncanonical Regulation of cAMP-Dependent Insulin Secretion and Its Implications in Type 2 Diabetes.Compr Physiol. 2023 Jun 26;13(3):5023-5049. doi: 10.1002/cphy.c220031. Compr Physiol. 2023. PMID: 37358504 Free PMC article.
-
The genetically encoded tool set for investigating cAMP: more than the sum of its parts.Front Pharmacol. 2015 Aug 6;6:164. doi: 10.3389/fphar.2015.00164. eCollection 2015. Front Pharmacol. 2015. PMID: 26300778 Free PMC article. Review.
References
-
- Adams SR, Harootunian AT, Buechler YJ, Taylor SS, Tsien RY. Fluorescence ratio imaging of cyclic AMP in single cells. Nature. 1991;349:694–697. - PubMed
-
- Zaccolo M, De GF, Cho CY, Feng L, Knapp T, et al. A genetically encoded, fluorescent indicator for cyclic AMP in living cells. Nat Cell Biol. 2000;2:25–29. - PubMed
-
- Zaccolo M, Pozzan T. Discrete microdomains with high concentration of cAMP in stimulated rat neonatal cardiac myocytes. Science. 2002;295:1711–1715. - PubMed
-
- Nikolaev VO, Bunemann M, Hein L, Hannawacker A, Lohse MJ. Novel single chain cAMP sensors for receptor-induced signal propagation. J Biol Chem. 2004;279:37215–37218. - PubMed
Publication types
MeSH terms
Substances
Grants and funding
- R01 DC006021/DC/NIDCD NIH HHS/United States
- F31 DC007591/DC/NIDCD NIH HHS/United States
- R01 DC006021-04A1/DC/NIDCD NIH HHS/United States
- R01DC000374/DC/NIDCD NIH HHS/United States
- R01DC006308/DC/NIDCD NIH HHS/United States
- R03 DK075487-01/DK/NIDDK NIH HHS/United States
- F31DC007591/DC/NIDCD NIH HHS/United States
- R01DC006021/DC/NIDCD NIH HHS/United States
- R01 DC006021-05/DC/NIDCD NIH HHS/United States
- R03 DK075487/DK/NIDDK NIH HHS/United States
- R01 DC006308/DC/NIDCD NIH HHS/United States
- R03 DK075487-02/DK/NIDDK NIH HHS/United States
- R03DK075487/DK/NIDDK NIH HHS/United States
- R01 DC000374/DC/NIDCD NIH HHS/United States
LinkOut - more resources
Full Text Sources
Other Literature Sources
Miscellaneous

