

Osteolineage niche cells initiate hematopoietic stem cell mobilization
- PMID: 18456874
- PMCID: PMC2481533
- DOI: 10.1182/blood-2008-01-133710
Osteolineage niche cells initiate hematopoietic stem cell mobilization
Retraction in
-
Mayack SR, Wagers AJ. Osteolineage niche cells initiate hematopoietic stem cell mobilization. Blood. 2008;112(3):519-531.Blood. 2012 Feb 16;119(7):1793. doi: 10.1182/blood-2011-12-401125. Epub 2011 Dec 24. Blood. 2012. PMID: 22197880 Free PMC article. No abstract available.
Abstract
Recent studies have implicated bone-lining osteoblasts as important regulators of hematopoietic stem cell (HSC) self-renewal and differentiation; however, because much of the evidence supporting this notion derives from indirect in vivo experiments, which are unavoidably complicated by the presence of other cell types within the complex bone marrow milieu, the sufficiency of osteoblasts in modulating HSC activity has remained controversial. To address this, we prospectively isolated mouse osteoblasts, using a novel flow cytometry-based approach, and directly tested their activity as HSC niche cells and their role in cyclophosphamide/granulocyte colony-stimulating factor (G-CSF)-induced HSC proliferation and mobilization. We found that osteoblasts expand rapidly after cyclophosphamide/G-CSF treatment and exhibit phenotypic and functional changes that directly influence HSC proliferation and maintenance of reconstituting potential. Effects of mobilization on osteoblast number and function depend on the function of ataxia telangiectasia mutated (ATM), the product of the Atm gene, demonstrating a new role for ATM in stem cell niche activity. These studies demonstrate that signals from osteoblasts can directly initiate and modulate HSC proliferation in the context of mobilization. This work also establishes that direct interaction with osteolineage niche cells, in the absence of additional environmental inputs, is sufficient to modulate stem cell activity.
Figures


 ) or with untreated (
 ) or cytokine-modified (D2; ■) osteoblasts for 12 hours. KTLS HSC frequency among input HPCs is also shown (□). Data are presented as the average frequency of KTLS HSC (± SD) as determined by FACS in short-term (12 hours) HPC:osteoblast cocultures (*P < .05). Data are compiled from 6 independent experiments performed. (C) Increased proliferation of CFSE-labeled KTLS HSC among Lin-depleted BM cells (HPC) cultured with cytokine-modified (HPC:D2, panel 3) compared with untreated (HPC:untreated, panel 2) osteoblasts after 36 hours. Histograms represent CFSE labeling of only those cells falling within the KTLS gate and are representative of 7 independent experiments. (D) Average frequency (± SD) of divided KTLS cells per peak (1, 2, 3, as indicated in panel C) in coculture experiments (*P < .05). (E) Increased cell survival in HPC cultures containing untreated or D2 osteoblast, compared with HPC cultured alone. Cultures were performed as described previously, and stained with KTLS surface markers in addition to markers of cell death and viability (annexin V (early apoptosis marker) and PI (late apoptosis marker)). Data are representative of 2 independent experiments. (F) Increased total numbers of KTLS HSCs in HPC:D2 cultures. HSC numbers were determined for each culture by multiplying the frequency of KTLS cells (determined by FACS) by the total number of cells present. Data are shown as the mean absolute cell number for each condition over 7 independent experiments plus or minus the SD (*P < .05).
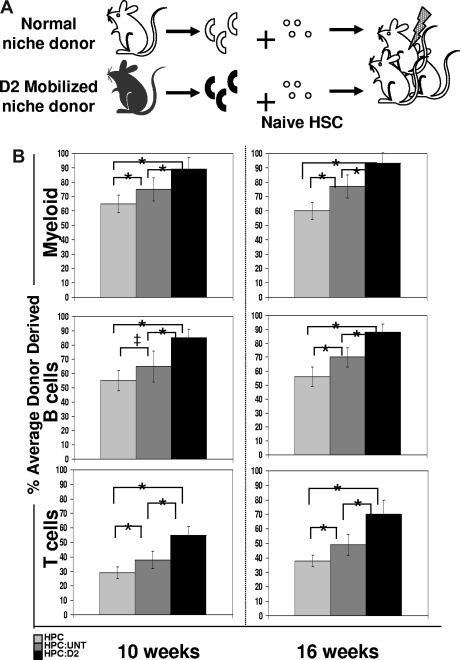
 ), or HPC:untreated (
 ) or HPC:D2 (▬) cocultures. The average engraftment was calculated by determining the percentage donor-derived myeloid (top; Mac-1+, Gr-1+), B (middle, B220+), and T (bottom, CD3+, CD4+, CD8+) cells at the indicated time points after transplant. Donor-derived cells were identified based on CFP transgene expression and were corrected for the percentage of CFP+ myeloid or lymphoid populations (80%-90%) in unmodified CFP+ transgenic hosts (*P < .05; ‡P = .0598). Error bars represent SD.
 ; ATM KO untreated, ▬) or treated with Cy/G (ATM WT D2, gray hatched; ATM KO D2, black hatched). Data are plotted as means ± SD (*P < .05). (B) Decreased osteoblast survival after Cy/G treatment in ATM-deficient mice. ATM WT or ATM KO mice were treated with Cy/G and osteoblasts were isolated from collagenase-treated bones and stained with osteoblast specific markers as well as cell viability markers (annexin V+, early apoptotic marker; and PI+, late apoptotic marker). Representative data for 2 independent experiments are shown. (C-E) Lower frequency and engraftment efficiency of wild-type HSC exposed for 12 hours to D2 ATM KO osteoblasts compared with HSC exposed to wild-type D2 osteoblasts. A total of 100,000 Lin− BM cells (HPC) from wild-type, untreated mice were exposed for 12 hours in vitro to 2000 OPN+ osteoblasts isolated from ATM KO or WT D2 mobilized mice (ATM WT untreated, ; ATM KO untreated, ▬; ATM KO D2, black hatched; ATM WT D2, gray hatched) and tested for HSC function by measuring in vitro maintenance of HSC frequency (C,D) compared with an HPC only control (gray dotted bar in panel D) and in vivo reconstitution potential (E) as described previously (Figures 4,5). Data are shown compared with an HPC only control (gray dotted) and an uncultured HPC control (■). Data are plotted as mean (± SD; *P < .05) and represent chimerism at 16 weeks after transplant. (F) Equivalent frequency of apoptotic (annexin V+, PI− early apoptotic) osteoblasts after 12-hour HPC:osteoblast coculture assays. Coculture assays were performed as described previously, and cells were stained for osteoblast specific markers and the cell death and viability markers annexin V (early apoptotic marker) and PI (late apoptotic marker). Representative data are shown for 2 independent experiments performed.
Comment in
-
Osteoblasts: yes, they can.Blood. 2008 Aug 1;112(3):455. doi: 10.1182/blood-2008-05-158758. Blood. 2008. PMID: 18650456 No abstract available.
-
Findings of research misconduct.NIH Guide Grants Contracts. 2012 Sep 7:NOT-OD-12-147. NIH Guide Grants Contracts. 2012. PMID: 22984698 Free PMC article. No abstract available.
-
Findings of Research Misconduct.Fed Regist. 2012 Aug 28;77(167):52034-52035. Fed Regist. 2012. PMID: 27737221 Free PMC article. No abstract available.
Similar articles
-
Hematopoietic stem cell mobilizing agents G-CSF, cyclophosphamide or AMD3100 have distinct mechanisms of action on bone marrow HSC niches and bone formation.Leukemia. 2012 Jul;26(7):1594-601. doi: 10.1038/leu.2012.17. Epub 2012 Jan 23. Leukemia. 2012. PMID: 22266913
-
Mobilization of hematopoietic stem cells by depleting bone marrow macrophages.Methods Mol Biol. 2012;904:117-38. doi: 10.1007/978-1-61779-943-3_11. Methods Mol Biol. 2012. PMID: 22890928
-
Cyclophosphamide/granulocyte colony-stimulating factor causes selective mobilization of bone marrow hematopoietic stem cells into the blood after M phase of the cell cycle.Blood. 2001 Apr 15;97(8):2278-85. doi: 10.1182/blood.v97.8.2278. Blood. 2001. PMID: 11290588
-
Many mechanisms mediating mobilization: an alliterative review.Curr Opin Hematol. 2011 Jul;18(4):231-8. doi: 10.1097/MOH.0b013e3283477962. Curr Opin Hematol. 2011. PMID: 21537168 Free PMC article. Review.
-
Cellular players of hematopoietic stem cell mobilization in the bone marrow niche.Int J Hematol. 2017 Feb;105(2):129-140. doi: 10.1007/s12185-016-2162-4. Epub 2016 Dec 10. Int J Hematol. 2017. PMID: 27943116 Review.
Cited by
-
Effects of iron overload on the bone marrow microenvironment in mice.PLoS One. 2015 Mar 16;10(3):e0120219. doi: 10.1371/journal.pone.0120219. eCollection 2015. PLoS One. 2015. PMID: 25774923 Free PMC article.
-
Pyk2 regulates megakaryocyte-induced increases in osteoblast number and bone formation.J Bone Miner Res. 2013 Jun;28(6):1434-45. doi: 10.1002/jbmr.1876. J Bone Miner Res. 2013. PMID: 23362087 Free PMC article.
-
Myeloproliferation and hematopoietic stem cell dysfunction due to defective Notch receptor modification by O-fucose glycans.Semin Immunopathol. 2012 May;34(3):455-69. doi: 10.1007/s00281-012-0303-2. Epub 2012 Mar 14. Semin Immunopathol. 2012. PMID: 22415200 Review.
-
Live-animal tracking of individual haematopoietic stem/progenitor cells in their niche.Nature. 2009 Jan 1;457(7225):92-6. doi: 10.1038/nature07434. Epub 2008 Dec 3. Nature. 2009. PMID: 19052546 Free PMC article.
-
Hematopoietic stem and progenitor cells: their mobilization and homing to bone marrow and peripheral tissue.Immunol Res. 2009;44(1-3):160-8. doi: 10.1007/s12026-009-8109-6. Immunol Res. 2009. PMID: 19340403 Review.
References
-
- Kondo M, Wagers AJ, Manz MG, et al. Biology of hematopoietic stem cells and progenitors: implications for clinical application. Annu Rev Immunol. 2003;21:759–806. - PubMed
-
- Zhang J, Niu C, Ye L, Huang H, et al. Identification of the haematopoietic stem cell niche and control of the niche size. Nature. 2003;425:836–841. - PubMed
-
- Zhu J, Emerson SG. A new bone to pick: osteoblasts and the haematopoietic stem-cell niche. Bioessays. 2004;26:595–599. - PubMed
-
- Nilsson SK, Johnston HM, Coverdale JA. Spatial localization of transplanted hemopoietic stem cells: inferences for the localization of stem cell niches. Blood. 2001;97:2293–2299. - PubMed
-
- Kiel MJ, Morrison SJ. Maintaining hematopoietic stem cells in the vascular niche. Immunity. 2006;25:862–864. - PubMed
Publication types
MeSH terms
Substances
Grants and funding
LinkOut - more resources
Full Text Sources
Other Literature Sources
Medical
Molecular Biology Databases
Research Materials
Miscellaneous
