HIV-induced changes in T cell signaling pathways
- PMID: 18453567
- PMCID: PMC2648824
- DOI: 10.4049/jimmunol.180.10.6490
HIV-induced changes in T cell signaling pathways
Abstract
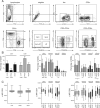
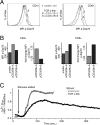
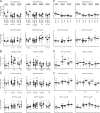
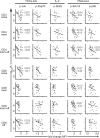
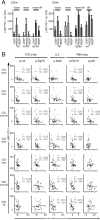
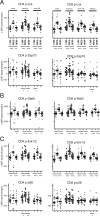
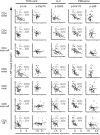
Infection with HIV usually results in chronic activation of the immune system, with profound quantitative and qualitative changes in the T cell compartment. To better understand the mechanistic basis for T cell dysfunction and to discern whether such mechanisms are reversed after effective antiviral treatment, we analyzed changes in signaling pathways of human CD4(+) and CD8(+) T cells from 57 HIV-infected subjects in varying stages of disease progression and treatment, including long-term nonprogressors, progressors, and chronically infected subjects provided effective antiretroviral therapy (responders). A previously described PhosFlow method was adapted and optimized so that protein phosphorylation could be visualized in phenotypically defined subpopulations of CD4(+) and CD8(+) T cells (naive, memory, and effector) by flow cytometry. T cell signaling induced by TCR cross-linking, IL-2, or PMA/ionomycin was found to be blunted within all T cell subpopulations in those with progressive HIV disease compared with long-term nonprogressors and responders. Although alterations in cellular signaling correlated with levels of basal phosphorylation, viral load, and/or expression of programmed death-1, it was the level of basal phosphorylation that appeared to be the factor most dominantly associated with impaired signaling. Notably, provision of effective antiretroviral therapy was associated with a normalization of both basal phosphorylation levels and T cell signaling. These data, in aggregate, suggest that generalized dysfunction of the T cell compartment during progressive HIV disease may be in part dependent upon an increased basal level of phosphorylation, which itself may be due to the heightened state of immune activation found in advanced disease.
Figures

Similar articles
-
T-cell signalling in antiretroviral-treated, aviraemic HIV-1-positive individuals is present in a raised state of basal activation that contributes to T-cell hyporesponsiveness.AIDS. 2011 Oct 23;25(16):1981-6. doi: 10.1097/QAD.0b013e32834b35a9. AIDS. 2011. PMID: 21811141
-
HIV-1-infected children on HAART: immunologic features of three different levels of viral suppression.Cytometry B Clin Cytom. 2007 Jan 15;72(1):14-21. doi: 10.1002/cyto.b.20152. Cytometry B Clin Cytom. 2007. PMID: 17041945 Clinical Trial.
-
Phenotypic, functional, and kinetic parameters associated with apparent T-cell control of human immunodeficiency virus replication in individuals with and without antiretroviral treatment.J Virol. 2005 Nov;79(22):14169-78. doi: 10.1128/JVI.79.22.14169-14178.2005. J Virol. 2005. PMID: 16254352 Free PMC article.
-
CD4+ and CD8+ T cell receptor repertoire perturbations with normal levels of T cell receptor excision circles in HIV-infected, therapy-naive adolescents.AIDS Res Hum Retroviruses. 2003 Jun;19(6):487-95. doi: 10.1089/088922203766774531. AIDS Res Hum Retroviruses. 2003. PMID: 12882658
-
Pathogenic mechanisms of B-lymphocyte dysfunction in HIV disease.J Allergy Clin Immunol. 2008 Jul;122(1):12-9; quiz 20-1. doi: 10.1016/j.jaci.2008.04.034. Epub 2008 Jun 10. J Allergy Clin Immunol. 2008. PMID: 18547629 Free PMC article. Review.
Cited by
-
High activation and skewed T cell differentiation are associated with low IL-17A levels in a hu-PBL-NSG-SGM3 mouse model of HIV infection.Clin Exp Immunol. 2020 May;200(2):185-198. doi: 10.1111/cei.13416. Epub 2020 Jan 21. Clin Exp Immunol. 2020. PMID: 31951011 Free PMC article.
-
HIV-1 infection abrogates CD8+ T cell mitogen-activated protein kinase signaling responses.J Virol. 2011 Dec;85(23):12343-50. doi: 10.1128/JVI.05682-11. Epub 2011 Sep 21. J Virol. 2011. PMID: 21937661 Free PMC article.
-
HIV disease progression correlates with the generation of dysfunctional naive CD8(low) T cells.Blood. 2011 Feb 17;117(7):2189-99. doi: 10.1182/blood-2010-06-288035. Epub 2011 Jan 3. Blood. 2011. PMID: 21200021 Free PMC article. Clinical Trial.
-
Evolving Strategies to Eliminate the CD4 T Cells HIV Viral Reservoir via CAR T Cell Immunotherapy.Front Immunol. 2022 Apr 29;13:873701. doi: 10.3389/fimmu.2022.873701. eCollection 2022. Front Immunol. 2022. PMID: 35572509 Free PMC article. Review.
-
Highly active antiretroviral therapy in patients infected with human immunodeficiency virus increases CD40 ligand expression and IL-12 production in cells ex vivo.Viral Immunol. 2011 Aug;24(4):281-9. doi: 10.1089/vim.2010.0142. Viral Immunol. 2011. PMID: 21830900 Free PMC article.
References
-
- Baier M, Werner A, Bannert N, Metzner K, Kurth R. HIV suppression by interleukin-16. Nature. 1995;378:563. - PubMed
-
- Cocchi F, DeVico AL, Garzino-Demo A, Arya SK, Gallo RC, Lusso P. Identification of RANTES, MIP-1 α, and MIP-1 β as the major HIV-suppressive factors produced by CD8+ T cells. Science. 1995;270:1811–1815. - PubMed
-
- Gulzar N, Copeland KF. CD8+ T-cells: function and response to HIV infection. Curr. HIV Res. 2004;2:23–37. - PubMed
Publication types
MeSH terms
Substances
Grants and funding
- AI 52745/AI/NIAID NIH HHS/United States
- UL1 RR 024131/RR/NCRR NIH HHS/United States
- R01 AI047062-07/AI/NIAID NIH HHS/United States
- R37 AI040312-09/AI/NIAID NIH HHS/United States
- UL1 RR024131-010004/RR/NCRR NIH HHS/United States
- R37 AI040312-10/AI/NIAID NIH HHS/United States
- K24 AI 69994/AI/NIAID NIH HHS/United States
- M01 RR 00083/RR/NCRR NIH HHS/United States
- P30 AI027763/AI/NIAID NIH HHS/United States
- AI 47062/AI/NIAID NIH HHS/United States
- R01 AI047062-06/AI/NIAID NIH HHS/United States
- P30 AI 27763/AI/NIAID NIH HHS/United States
- DPI OD 00329/OD/NIH HHS/United States
- R37 AI040312-12/AI/NIAID NIH HHS/United States
- R01 AI047062-08/AI/NIAID NIH HHS/United States
- K24 AI069994/AI/NIAID NIH HHS/United States
- R01 AI052745/AI/NIAID NIH HHS/United States
- UL1 RR024131/RR/NCRR NIH HHS/United States
- DP1 OD000329/OD/NIH HHS/United States
- R01 AI 40312/AI/NIAID NIH HHS/United States
- R37 AI040312-11/AI/NIAID NIH HHS/United States
- UL1 RR024131-01S2/RR/NCRR NIH HHS/United States
- R37 AI040312-08/AI/NIAID NIH HHS/United States
- R37 AI040312/AI/NIAID NIH HHS/United States
- P30 MH 59037/MH/NIMH NIH HHS/United States
- R01 AI040312/AI/NIAID NIH HHS/United States
- M01 RR000083/RR/NCRR NIH HHS/United States
- UL1 RR024131-010001/RR/NCRR NIH HHS/United States
- R01 AI047062-09/AI/NIAID NIH HHS/United States
- R01 AI047062/AI/NIAID NIH HHS/United States
LinkOut - more resources
Full Text Sources
Other Literature Sources
Medical
Research Materials
Miscellaneous

