Cancer stem cells contribute to cisplatin resistance in Brca1/p53-mediated mouse mammary tumors
- PMID: 18451150
- PMCID: PMC2929908
- DOI: 10.1158/0008-5472.CAN-07-5480
Cancer stem cells contribute to cisplatin resistance in Brca1/p53-mediated mouse mammary tumors
Abstract
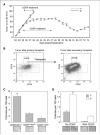
The majority of BRCA1-associated breast cancers are basal cell-like, which is associated with a poor outcome. Using a spontaneous mouse mammary tumor model, we show that platinum compounds, which generate DNA breaks during the repair process, are more effective than doxorubicin in Brca1/p53-mutated tumors. At 0.5 mg/kg of daily cisplatin treatment, 80% primary tumors (n = 8) show complete pathologic response. At greater dosages, 100% show complete response (n = 19). However, after 2 to 3 months of complete remission following platinum treatment, tumors relapse and become refractory to successive rounds of treatment. Approximately 3.8% to 8.0% (mean, 5.9%) of tumor cells express the normal mammary stem cell markers, CD29(hi)24(med), and these cells are tumorigenic, whereas CD29(med)24(-/lo) and CD29(med)24(hi) cells have diminished tumorigenicity or are nontumorigenic, respectively. In partially platinum-responsive primary transplants, 6.6% to 11.0% (mean, 8.8%) tumor cells are CD29(hi)24(med); these populations significantly increase to 16.5% to 29.2% (mean, 22.8%; P < 0.05) in platinum-refractory secondary tumor transplants. Further, refractory tumor cells have greater colony-forming ability than the primary transplant-derived cells in the presence of cisplatin. Expression of a normal stem cell marker, Nanog, is decreased in the CD29(hi)24(med) populations in the secondary transplants. Top2A expression is also down-regulated in secondary drug-resistant tumor populations and, in one case, was accompanied by genomic deletion of Top2A. These studies identify distinct cancer cell populations for therapeutic targeting in breast cancer and implicate clonal evolution and expansion of cancer stem-like cells as a potential cause of chemoresistance.
Figures


Similar articles
-
Tumor-initiating cells are not enriched in cisplatin-surviving BRCA1;p53-deficient mammary tumor cells in vivo.Cell Cycle. 2010 Sep 15;9(18):3780-91. doi: 10.4161/cc.9.18.13002. Epub 2010 Sep 13. Cell Cycle. 2010. PMID: 20855963 Free PMC article.
-
Sensitivity and acquired resistance of BRCA1;p53-deficient mouse mammary tumors to the topoisomerase I inhibitor topotecan.Cancer Res. 2010 Feb 15;70(4):1700-10. doi: 10.1158/0008-5472.CAN-09-3367. Epub 2010 Feb 9. Cancer Res. 2010. PMID: 20145144
-
High sensitivity of BRCA1-deficient mammary tumors to the PARP inhibitor AZD2281 alone and in combination with platinum drugs.Proc Natl Acad Sci U S A. 2008 Nov 4;105(44):17079-84. doi: 10.1073/pnas.0806092105. Epub 2008 Oct 29. Proc Natl Acad Sci U S A. 2008. PMID: 18971340 Free PMC article.
-
How do real tumors become resistant to cisplatin?Cell Cycle. 2008 May 15;7(10):1353-9. doi: 10.4161/cc.7.10.5930. Epub 2008 Mar 17. Cell Cycle. 2008. PMID: 18418074 Review.
-
Triple negative breast cancer--current status and prospective targeted treatment based on HER1 (EGFR), TOP2A and C-MYC gene assessment.Biomed Pap Med Fac Univ Palacky Olomouc Czech Repub. 2009 Mar;153(1):13-7. doi: 10.5507/bp.2009.002. Biomed Pap Med Fac Univ Palacky Olomouc Czech Repub. 2009. PMID: 19365520 Review.
Cited by
-
Cancer stem cell vaccination confers significant antitumor immunity.Cancer Res. 2012 Apr 1;72(7):1853-64. doi: 10.1158/0008-5472.CAN-11-1400. Cancer Res. 2012. PMID: 22473314 Free PMC article.
-
Annexin A1 Is Required for Efficient Tumor Initiation and Cancer Stem Cell Maintenance in a Model of Human Breast Cancer.Cancers (Basel). 2021 Mar 8;13(5):1154. doi: 10.3390/cancers13051154. Cancers (Basel). 2021. PMID: 33800279 Free PMC article.
-
Natural and herbal compounds targeting breast cancer, a review based on cancer stem cells.Iran J Basic Med Sci. 2020 Aug;23(8):970-983. doi: 10.22038/ijbms.2020.43745.10270. Iran J Basic Med Sci. 2020. PMID: 32952942 Free PMC article. Review.
-
The effects of deregulated DNA damage signalling on cancer chemotherapy response and resistance.Nat Rev Cancer. 2012 Sep;12(9):587-98. doi: 10.1038/nrc3342. Nat Rev Cancer. 2012. PMID: 22918414 Review.
-
Pancreatic cancer stem cells: emerging target for designing novel therapy.Cancer Lett. 2013 Sep 10;338(1):94-100. doi: 10.1016/j.canlet.2012.03.018. Epub 2012 Mar 20. Cancer Lett. 2013. PMID: 22445908 Free PMC article. Review.
References
-
- Antoniou AC, Easton DF. Models of genetic susceptibility to breast cancer. Oncogene. 2006;25:5898–905. - PubMed
-
- Walsh T, King MC. Ten genes for inherited breast cancer. Cancer Cell. 2007;11:103–5. - PubMed
-
- Esteller M, Silva JM, Dominguez G, et al. Promoter hypermethylation and BRCA1 inactivation in sporadic breast and ovarian tumors. J Natl Cancer Inst. 2000;92:564–9. - PubMed
-
- Ting NS, Lee WH. The DNA double-strand break response pathway: becoming more BRCAish than ever. DNA Repair (Amst) 2004;3:935–44. - PubMed
-
- Turner N, Tutt A, Ashworth A. Hallmarks of “BRCA-ness” in sporadic cancers. Nat Rev Cancer. 2004;4:814–9. - PubMed
Publication types
MeSH terms
Substances
Grants and funding
LinkOut - more resources
Full Text Sources
Other Literature Sources
Molecular Biology Databases
Research Materials
Miscellaneous

