

Nutlin-3a activates p53 to both down-regulate inhibitor of growth 2 and up-regulate mir-34a, mir-34b, and mir-34c expression, and induce senescence
- PMID: 18451145
- PMCID: PMC2440635
- DOI: 10.1158/0008-5472.CAN-07-2780
Nutlin-3a activates p53 to both down-regulate inhibitor of growth 2 and up-regulate mir-34a, mir-34b, and mir-34c expression, and induce senescence
Abstract
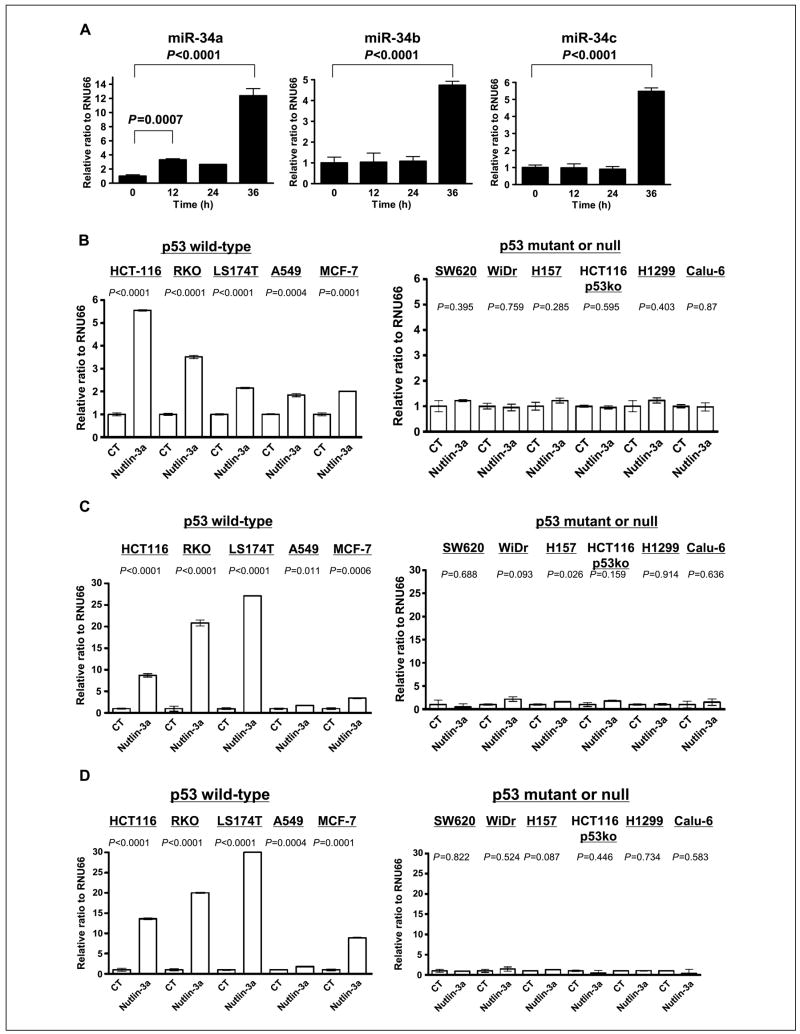
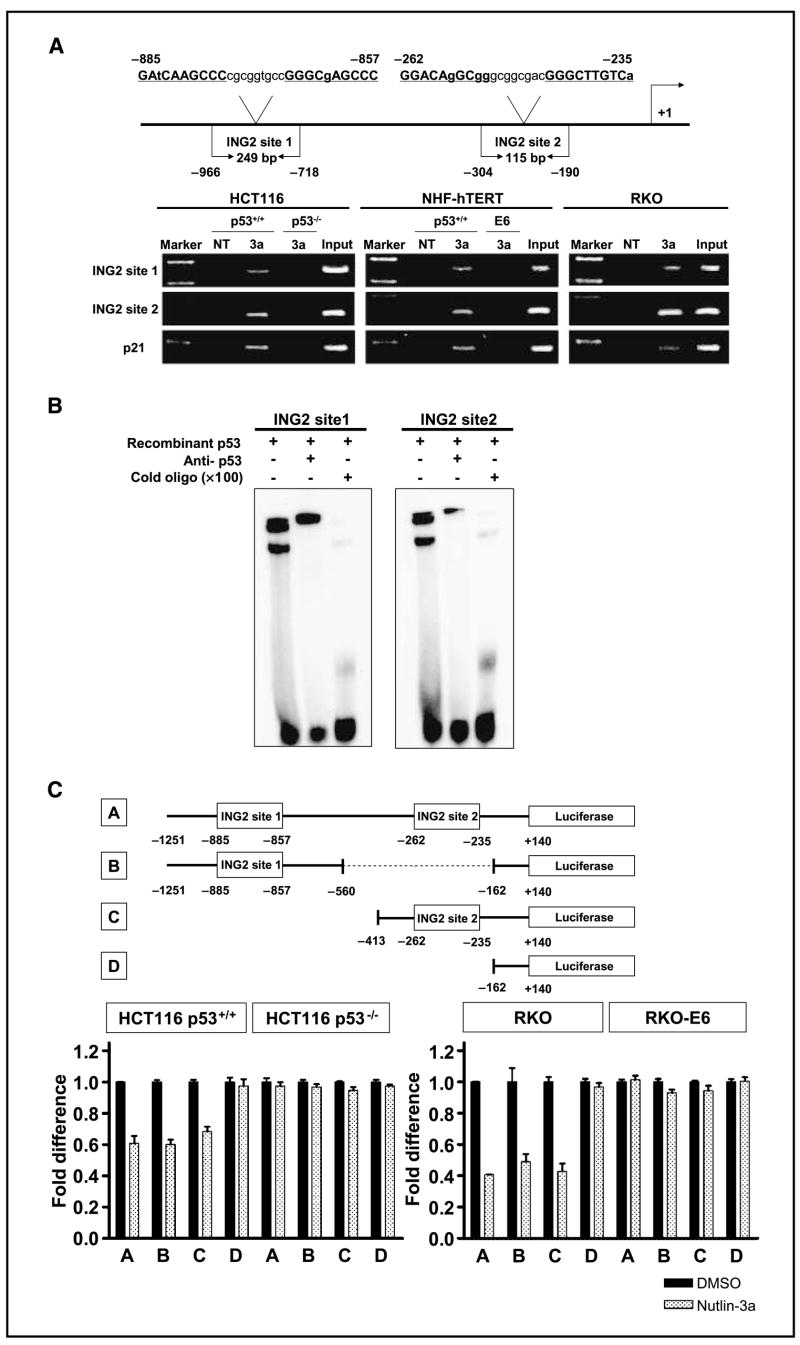
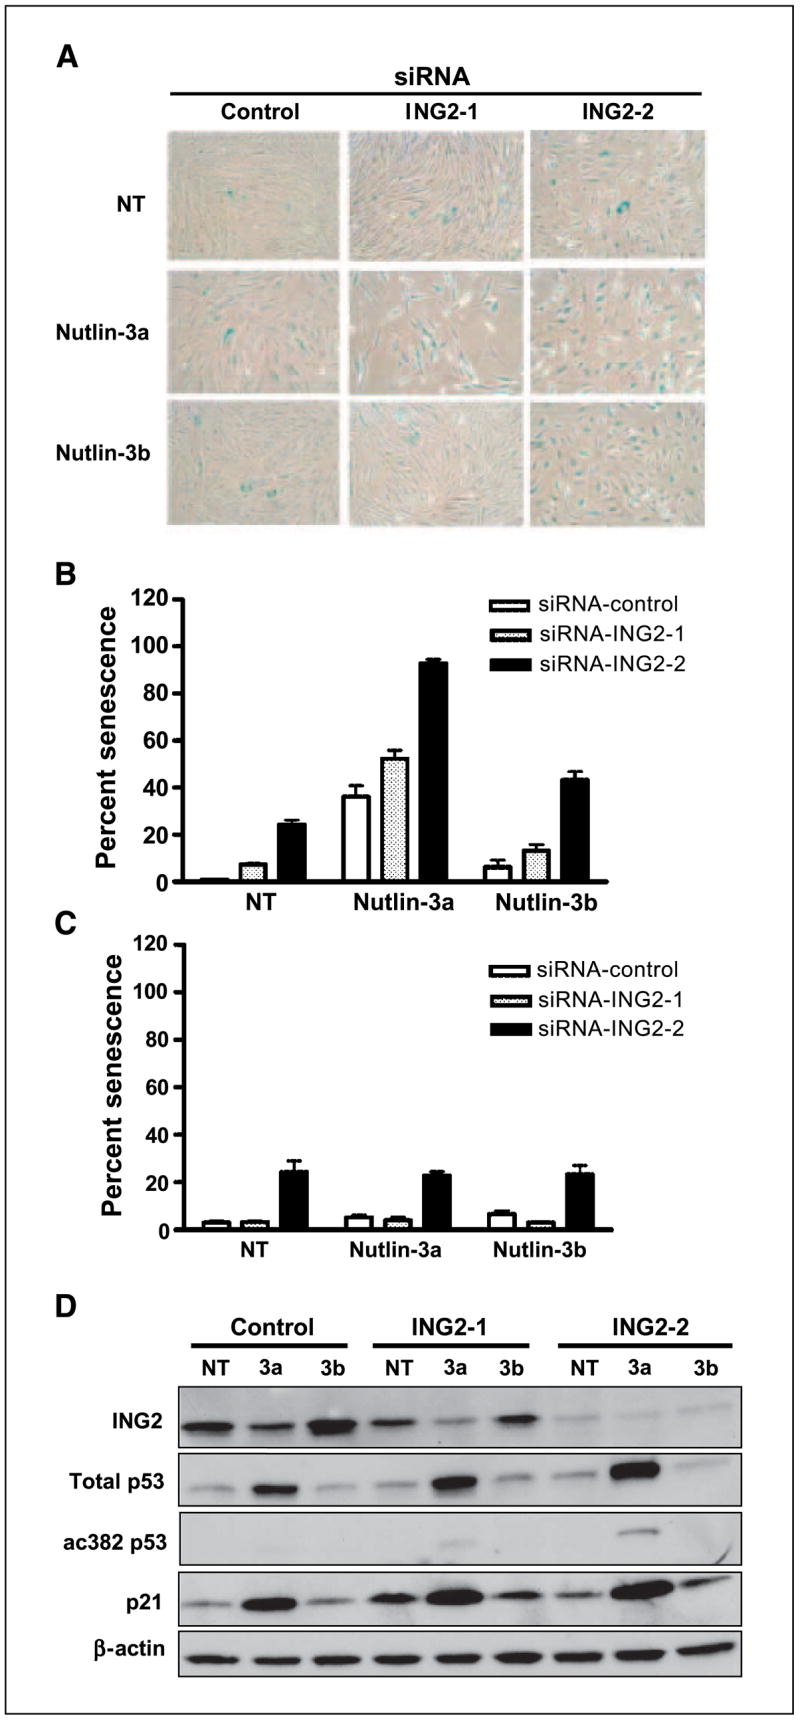
Nutlin-3, an MDM2 inhibitor, activates p53, resulting in several types of cancer cells undergoing apoptosis. Although p53 is mutated or deleted in approximately 50% of all cancers, p53 is still functionally active in the other 50%. Consequently, nutlin-3 and similar drugs could be candidates for neoadjuvant therapy in cancers with a functional p53. Cellular senescence is also a phenotype induced by p53 activation and plays a critical role in protecting against tumor development. In this report, we found that nutlin-3a can induce senescence in normal human fibroblasts. Nutlin-3a activated and repressed a large number of p53-dependent genes, including those encoding microRNAs. mir-34a, mir-34b, and mir-34c, which have recently been shown to be downstream effectors of p53-mediated senescence, were up-regulated, and inhibitor of growth 2 (ING2) expression was suppressed by nutlin-3a treatment. Two candidates for a p53-DNA binding consensus sequence were found in the ING2 promoter regulatory region; thus, we performed chromatin immunoprecipitation and electrophoretic mobility shift assays and confirmed p53 binding directly to those sites. In addition, the luciferase activity of a construct containing the ING2 regulatory region was repressed after p53 activation. Antisense knockdown of ING2 induces p53-independent senescence, whereas overexpression of ING2 induces p53-dependent senescence. Taken together, we conclude that nutlin-3a induces senescence through p53 activation in normal human fibroblasts, and p53-mediated mir34a, mir34b, and mir34c up-regulation and ING2 down-regulation may be involved in the senescence pathway.
Figures


Similar articles
-
Activation of p53 by nutlin-3a induces apoptosis and cellular senescence in human glioblastoma multiforme.PLoS One. 2011 Apr 5;6(4):e18588. doi: 10.1371/journal.pone.0018588. PLoS One. 2011. PMID: 21483692 Free PMC article.
-
Activation of p53 by Nutlin-3a, an antagonist of MDM2, induces apoptosis and cellular senescence in adult T-cell leukemia cells.Leukemia. 2009 Nov;23(11):2090-101. doi: 10.1038/leu.2009.171. Epub 2009 Aug 27. Leukemia. 2009. PMID: 19710698
-
Cooperation of Nutlin-3a and a Wip1 inhibitor to induce p53 activity.Oncotarget. 2016 May 31;7(22):31623-38. doi: 10.18632/oncotarget.9302. Oncotarget. 2016. PMID: 27183917 Free PMC article.
-
The guardian's little helper: microRNAs in the p53 tumor suppressor network.Cancer Res. 2007 Dec 1;67(23):11099-101. doi: 10.1158/0008-5472.CAN-07-2672. Cancer Res. 2007. PMID: 18056431 Review.
-
ING1 and ING2: multifaceted tumor suppressor genes.Cell Mol Life Sci. 2013 Oct;70(20):3753-72. doi: 10.1007/s00018-013-1270-z. Epub 2013 Feb 15. Cell Mol Life Sci. 2013. PMID: 23412501 Free PMC article. Review.
Cited by
-
MicroRNAs miR-146a/b negatively modulate the senescence-associated inflammatory mediators IL-6 and IL-8.Aging (Albany NY). 2009 Apr;1(4):402-11. doi: 10.18632/aging.100042. Aging (Albany NY). 2009. PMID: 20148189 Free PMC article.
-
Coupling transcriptional and post-transcriptional miRNA regulation in the control of cell fate.Aging (Albany NY). 2009 Sep 8;1(9):762-70. doi: 10.18632/aging.100085. Aging (Albany NY). 2009. PMID: 20157565 Free PMC article. Review.
-
MicroRNA expression and clinical outcomes in patients treated with adjuvant chemotherapy after complete resection of non-small cell lung carcinoma.Cancer Res. 2010 Nov 1;70(21):8288-98. doi: 10.1158/0008-5472.CAN-10-1348. Epub 2010 Oct 26. Cancer Res. 2010. PMID: 20978195 Free PMC article. Clinical Trial.
-
p53-Repressed miRNAs are involved with E2F in a feed-forward loop promoting proliferation.Mol Syst Biol. 2008;4:229. doi: 10.1038/msb.2008.65. Epub 2008 Nov 25. Mol Syst Biol. 2008. PMID: 19034270 Free PMC article.
-
miR-34a expression, epigenetic regulation, and function in human placental diseases.Epigenetics. 2014 Jan;9(1):142-51. doi: 10.4161/epi.26196. Epub 2013 Sep 30. Epigenetics. 2014. PMID: 24081307 Free PMC article.
References
-
- Vousden KH, Lane DP. p53 in health and disease. Nat Rev Mol Cell Biol. 2007;8:275–83. - PubMed
-
- Itahana K, Dimri G, Campisi J. Regulation of cellular senescence by p53. Eur J Biochem. 2001;268:2784–91. - PubMed
-
- Serrano M, Lin AW, McCurrach ME, Beach D, Lowe SW. Oncogenic ras provokes premature cell senescence associated with accumulation of p53 and p16INK4a. Cell. 1997;88:593–602. - PubMed
-
- Hayflick L, Moorhead PS. The limited in vitro lifetime of human diploid cell strains. Exp Cell Res. 1961;25:585–621. - PubMed
-
- Collado M, Gil J, Efeyan A, et al. Tumour biology: senescence in premalignant tumours. Nature. 2005;436:642. - PubMed
Publication types
MeSH terms
Substances
Grants and funding
LinkOut - more resources
Full Text Sources
Other Literature Sources
Research Materials
Miscellaneous
