. 2008 Apr:Chapter 10:Unit 10.11.
doi: 10.1002/0471142905.hg1011s57.

The Catalogue of Somatic Mutations in Cancer (COSMIC)

Affiliations

The Catalogue of Somatic Mutations in Cancer (COSMIC)

S A Forbes et al. Curr Protoc Hum Genet. 2008 Apr.

Abstract

COSMIC is currently the most comprehensive global resource for information on somatic mutations in human cancer, combining curation of the scientific literature with tumor resequencing data from the Cancer Genome Project at the Sanger Institute, U.K. Almost 4800 genes and 250000 tumors have been examined, resulting in over 50000 mutations available for investigation. This information can be accessed in a number of ways, the most convenient being the Web-based system which allows detailed data mining, presenting the results in easily interpretable formats. This unit describes the graphical system in detail, elaborating an example walkthrough and the many ways that the resulting information can be thoroughly investigated by combining data, respecializing the query, or viewing the results in different ways. Alternate protocols overview the available precompiled data files available for download.


Figures

Figure 10.11.1
Figure 10.11.1
The main COSMIC home page detailing current content statistics and top-level search options. The statistics are regenerated every release; in this case, the numbers relate to the October 2007 release. For color version of this figure see http://www.currentprotocols.com.
Figure 10.11.2
Figure 10.11.2
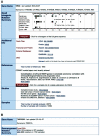
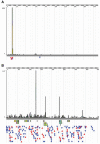
(A) The Gene overview page for KRAS, providing summary statistics of the mutation data, links to the data source overview pages (paper or study) and a series of links external to COSMIC. (B) For a gene with fusion data (e.g., TMPRSS2), an extra element is inserted after the graphical mutation summary, detailing its fusion partners and mutation statistics. For color version of this figure see http://www.currentprotocols.com.
Figure 10.11.3
Figure 10.11.3
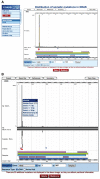
Graphical representation of the mutation spectrum across the KRAS gene on the amino acid scale (A) and on the nucleotide scale (B). Note the novel introduction of complex mutations. Frequently two or three of these equal nucleotide substitutions, these often result in missense mutations at the peptide level, not separable in the amino acid view (A). The small popup menu (shown in B; available for all mutation types) offers zooming options and details links. For color version of this figure see http://www.currentprotocols.com.
Figure 10.11.4
Figure 10.11.4
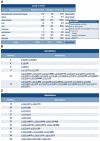
(A) Details table from the histogram page, detailing the per-tissue and total sample counts and mutation rates. Only a small portion is shown; 13 tissue types are above “haematopoietic and lymphoid tissue” and 18 below “pancreas.” Clicking on the More Details column shows a small popup menu, linking to tabular details of the samples examined for the tissue type chosen. (B) Excerpt from the Mutations table on the histogram page viewed at the amino acid level, detailing (in this sample of a large table up to codon 13 of KRAS) each sequence variant observed on the gene, together with the number of times observed (in parentheses) and a link to its own summary page. Subsequently this table may display details of other mutation types. (C) Excerpt from the Mutations table of the histogram page, detailing at the nucleotide level all the sequence variants observed up to codon 13 (nucleotide 39) of KRAS. A count of each mutation is shown, together with a link to that mutation's summary page. For color version of this figure see http://www.currentprotocols.com.
Figure 10.11.5
Figure 10.11.5
The histogram graphic showing the cDNA view of KRAS when zoomed in to the mutation peak between 30 and 40 bp (of the CDS). For color version of this figure see http://www.currentprotocols.com.
Figure 10.11.6
Figure 10.11.6
The five most mutated genes in the specialized phenotype, ductal carcinoma of the pancreatic ampulla of Vater (Pancreas: Ampulla of Vater; Carcinoma: Ductal Carcinoma). The small popup menu summarizes the tabulated data for the selected gene, and a link to the histogram page. For color version of this figure see http://www.currentprotocols.com.
Figure 10.11.7
Figure 10.11.7
Starting from the Tissue Overview in Figure 10.14.6, the histogram and tables reflect specialized phenotypes, showing only the data from samples with this specific cancer type. For color version of this figure see http://www.currentprotocols.com.
Figure 10.11.8
Figure 10.11.8
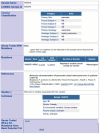
The Mutation Summary page for the highly oncogenic c.35G>T KRAS mutation. All details of this mutation are presented here, including the Associated Samples list, which is a potentially very long list of samples in which this mutation has been found. Sample names and tissues are linked. For color version of this figure see http://www.currentprotocols.com.
Figure 10.11.9
Figure 10.11.9
COSMIC data viewed in the Ensembl genome browser, starting from the Mutation Summary in Figure 10.11.8. By default initially zoomed into the coordinates immediately around the mutation specified (KRAS c.35G>T), zooming out gives a view of the genomic context of the COSMIC gene and its mutation spectrum (crosses denote substitutions, filled triangles denote insertions and deletions). Closely positioned mutations are arranged vertically, so if there are many (as in KRAS), the page can become very long. Hashed grey horizontal bars have been used in the figure to indicate where data have been cut. For color version of this figure see http://www.currentprotocols.com.
Figure 10.11.10
Figure 10.11.10
Selected information boxes from the Sample Overview page, detailing a choice from the c.35G>T Mutation Summary page. This page can be very long, as it brings together all the information about the sample, which can be extensive. This figure only includes data of importance. Further details can include genotypically synonymous samples, external data sources with further information (LOH analysis, extensive genotyping), and further isolated data points extracted from the paper about the sample (e.g., stage, grade, ethnicity, karyotype). CGP samples often include a link to the CGP study, together with microsatellite instability and genotyping data. In this page, the list of mutations and nonmutant genes can be somewhat lengthy. For color version of this figure see http://www.currentprotocols.com.
Figure 10.11.11
Figure 10.11.11
(A) The information box displayed under the histogram when COSMIC has information on fusion events involving the selected gene (in this example, TMPRSS2). (B) The Fusion Summary page for the TMPRSS2/ETV1 gene pair. Inferred breakpoints are displayed in the table, and observed mRNAs are displayed graphically. Similar to the Mutation Summary page, there is a tabulated breakdown of mutation frequencies by primary tissue type. Finally, the publications used to generate the data are summarized. Clicking on a mutation ID or a graphically rendered transcript provides further information on that individual fusion mutation. For color version of this figure see http://www.currentprotocols.com.
Figure 10.11.12
Figure 10.11.12
The main COSMIC workflow. After initial selection of a gene or phenotype to examine, the detail pages link together in a web, allowing navigation through sample, gene, and mutation details, together with redefinition, specialization, or generalization of the initial selection. For color version of this figure see http://www.currentprotocols.com.
Figure 10.11.13
Figure 10.11.13
The COSMIC Web site overviews the data from three distinct subprojects. The gold pages describe the data derived from curation of the scientific literature, the red pages display results from the CGP resequencing project, and the green pages detail results of the cancer cell line project. The gold page is simply descriptive, while the green and red pages front Web sites that allow full independent navigation of the subproject's data. For color version of this figure see http://www.currentprotocols.com.
Figure 10.11.14
Figure 10.11.14
COSMIC's histogram can give an immediate indication of a gene's oncogenic mutability. (A) Gain-of-function. The KRAS histogram shows only a single spike of a missense mutations at residue 12, known to be the protein's key mutant position, regulating its transcriptional activation capacity via the MAP/ERK pathway. Mutating p.G12 causes a gain-of-function overactivation of downstream growth promotion signals, resulting in tumorigenesis. (B) Loss-of-function. The PTEN histogram, conversely, shows a wide mutation spectrum, spread across the entire gene's length and including all mutation types. This clear loss-of-function mutation pattern is indicative of a tumor suppressor gene, whereby tumorigenesis occurs after the gene's growth-inhibiting effect is destroyed. For color version of this figure see http://www.currentprotocols.com.
Figure 10.11.15
Figure 10.11.15
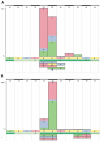
Using COSMIC's histogram to view the tissue-specific mutation spectra in the KRAS gene for (A) lung and (B) pancreas. For color version of this figure see http://www.currentprotocols.com.
Figure 10.11.16
Figure 10.11.16
The same data selection (a mutation summary of the ERBB2 gene, with domain structures removed) shows significantly different data when viewed between COSMIC's three color-coded Web sites: (A) the main COSMIC site (blue), (B) the CGP resequencing site (red), and (C) the Cancer Cell Line Project (green). For color version of this figure see http://www.currentprotocols.com.
Figure 10.11.16
Figure 10.11.16
The same data selection (a mutation summary of the ERBB2 gene, with domain structures removed) shows significantly different data when viewed between COSMIC's three color-coded Web sites: (A) the main COSMIC site (blue), (B) the CGP resequencing site (red), and (C) the Cancer Cell Line Project (green). For color version of this figure see http://www.currentprotocols.com.

Similar articles

Cited by

References

Literature Cited

    1. Bergmann F, Aulmann S, Wente MN, Penzel R, Esposito I, Kleeff J, Friess H, Schirmacher P. Molecular characterisation of pancreatic ductal adenocarcinoma in patients under 40. J. Clin. Pathol. 2006;59:580–584. - PMC - PubMed
    1. Cooper DN, Stenson PD, Chuzhanove NA. The human gene mutation database (HGMD) and its exploitation in the study of human mutational mechanisms. Curr. Protoc. Bioinform. 2005;12:1.13.1–1.13.20. - PubMed
    1. denDunnen JT, Antonarakis SE. Mutation nomenclature extensions and suggestions to describe complex mutations: A discussion. Hum. Mutat. 2000;15:7–12. - PubMed
    1. Edkins S, O'Meara S, Parker A, Stevens C, Reis M, Jones S, Greenman C, Davies H, Dalgliesh G, Forbes S, Hunter C, Smith R, Stephens P, Goldstraw P, Nicholson A, Chan TL, Velculescu VE, Yuen ST, Leung SY, Stratton MR, Futreal PA. Recurrent KRAS codon 146 mutations in human colorectal cancer. Cancer Biol. Ther. 2006;5:928–932. - PMC - PubMed
    1. Futreal PA, Coin L, Marshall M, Down T, Hubbard T, Wooster R, Rahman N, Stratton MR. A census of human cancer genes. Nat. Rev. Cancer. 2004;4:177–183. - PMC - PubMed

Internet Resources

    1. COSMIC home page. http://www.sanger.ac.uk/cosmic.
    1. Ensembl home page. http://www.ensembl.org.
    1. Cancer Gene Census. http://www.sanger.ac.uk/genetics/cgp/census.

LinkOut - more resources