. 2008 Aug 5;191(1):77-87.
doi: 10.1016/j.bbr.2008.03.013. Epub 2008 Mar 18.

The social zebrafish: behavioral responses to conspecific, heterospecific, and computer animated fish

Affiliations

The social zebrafish: behavioral responses to conspecific, heterospecific, and computer animated fish

Cristina Saverino et al. Behav Brain Res. .

Abstract

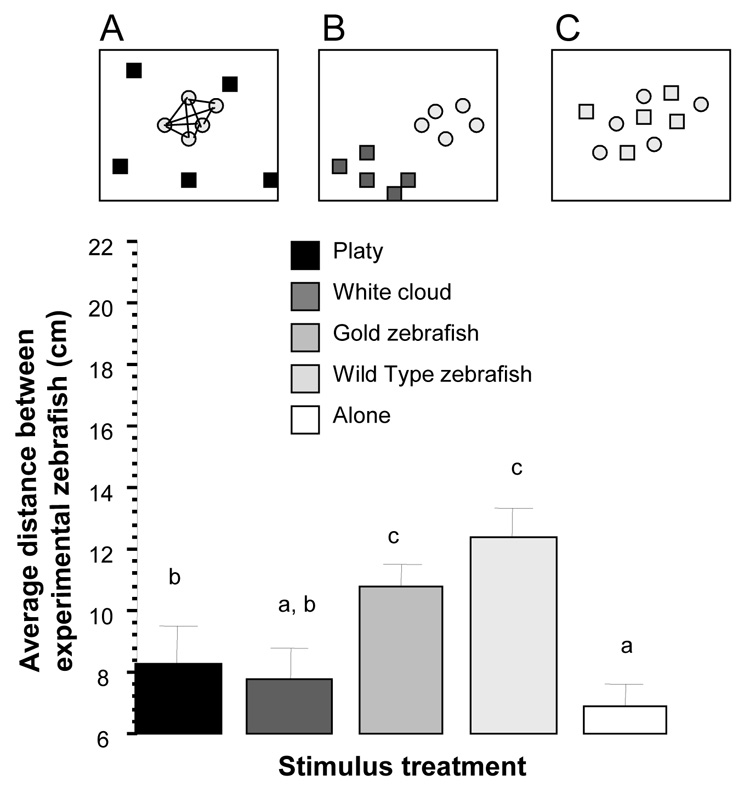
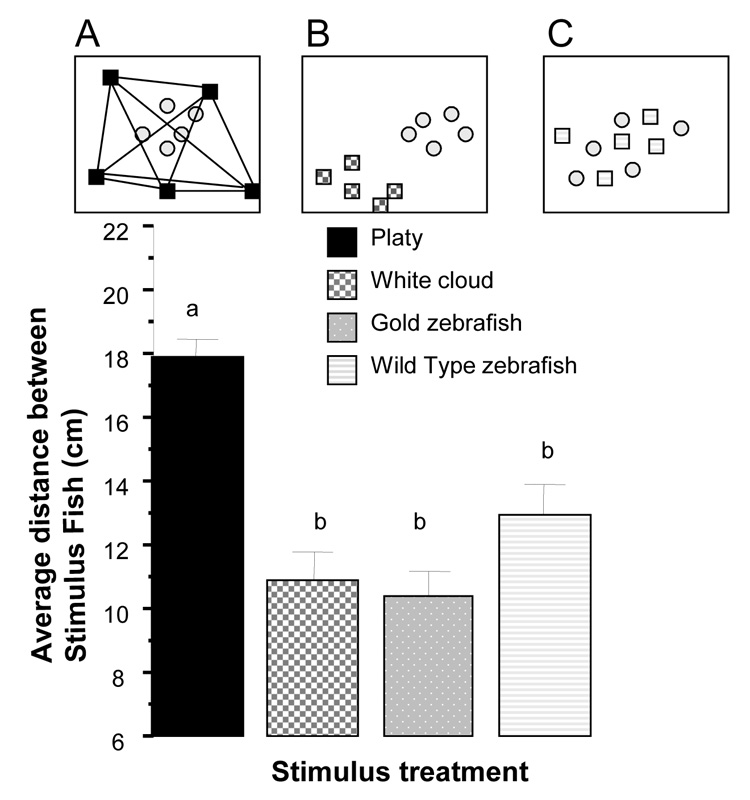
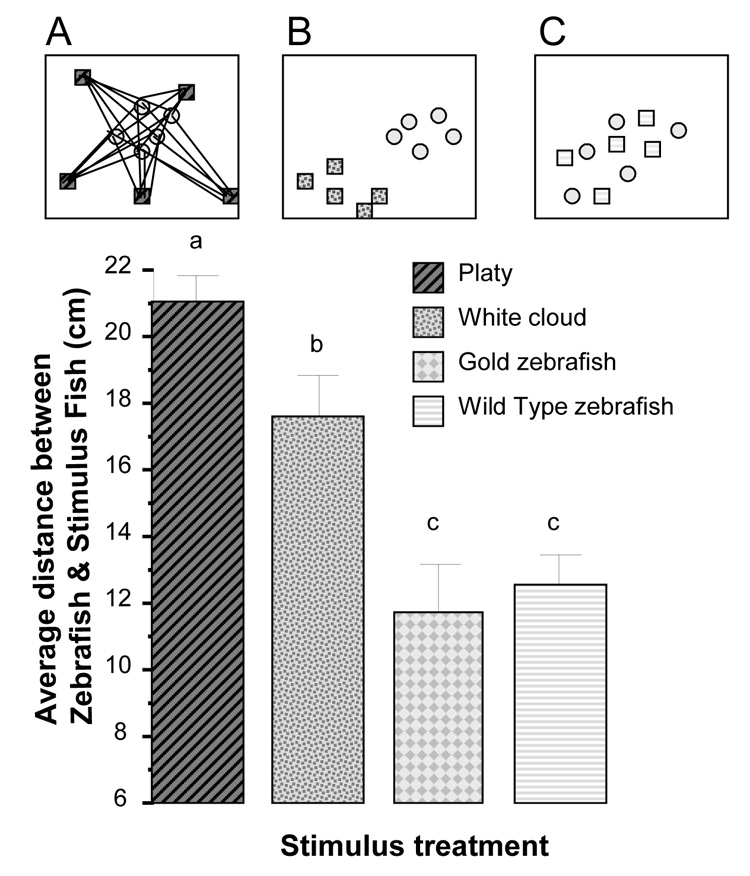
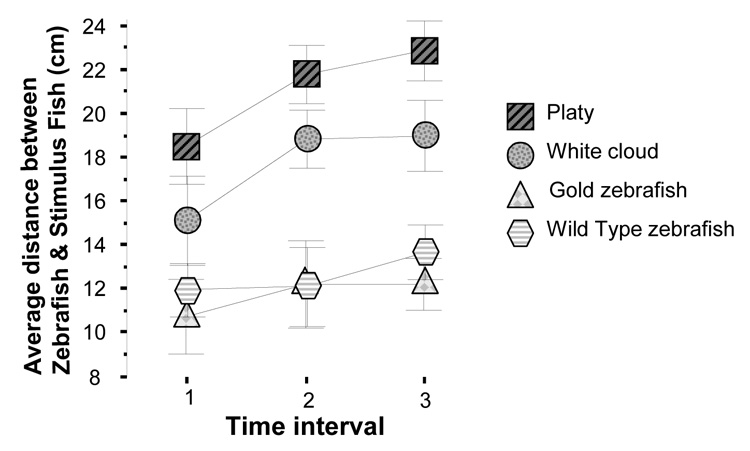
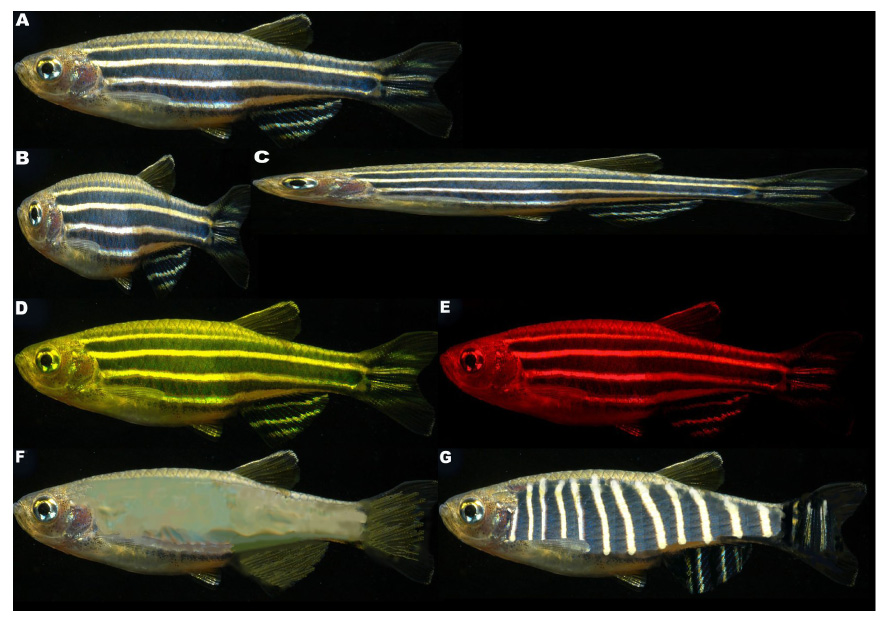
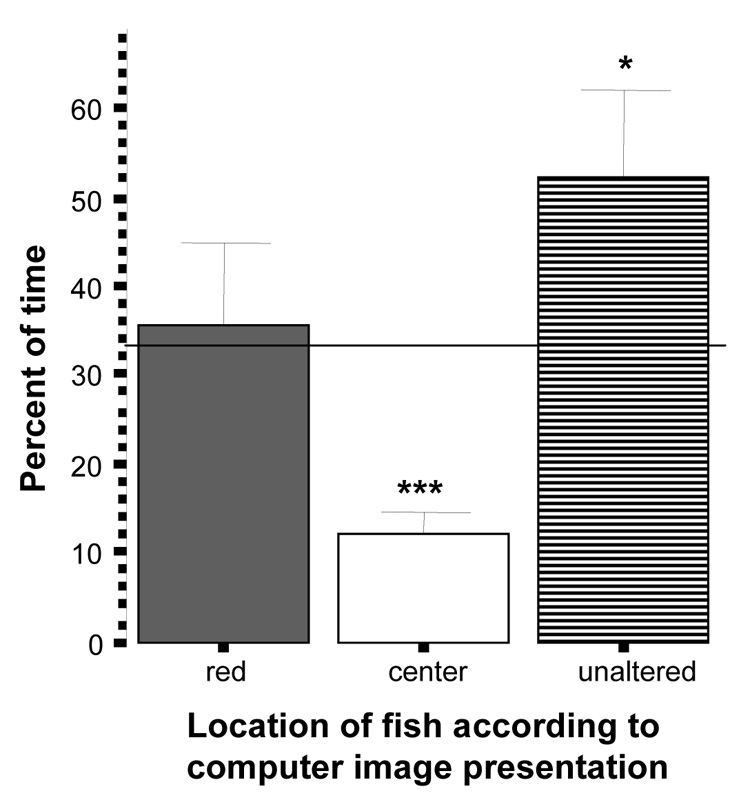
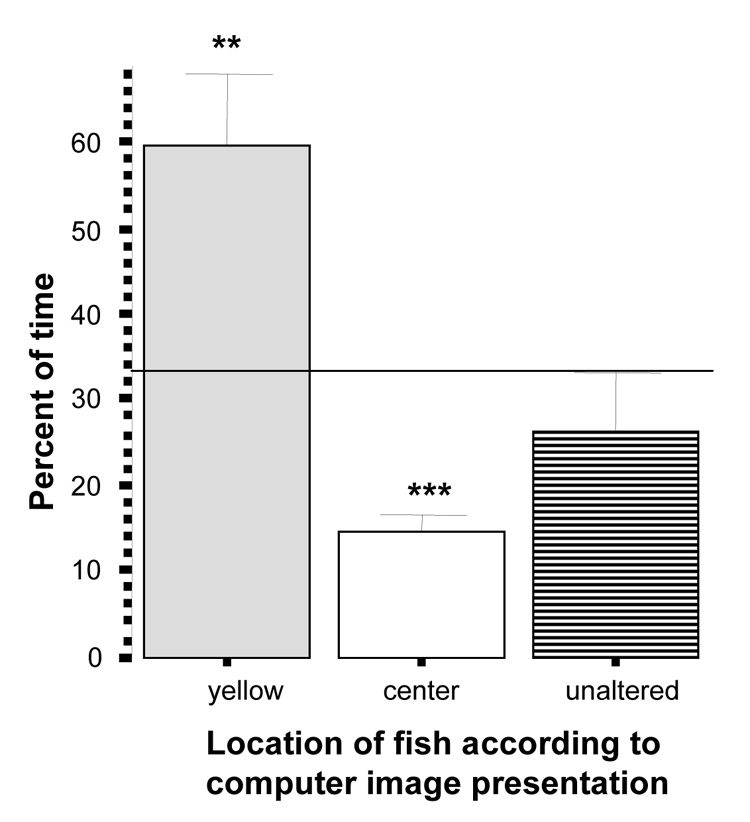
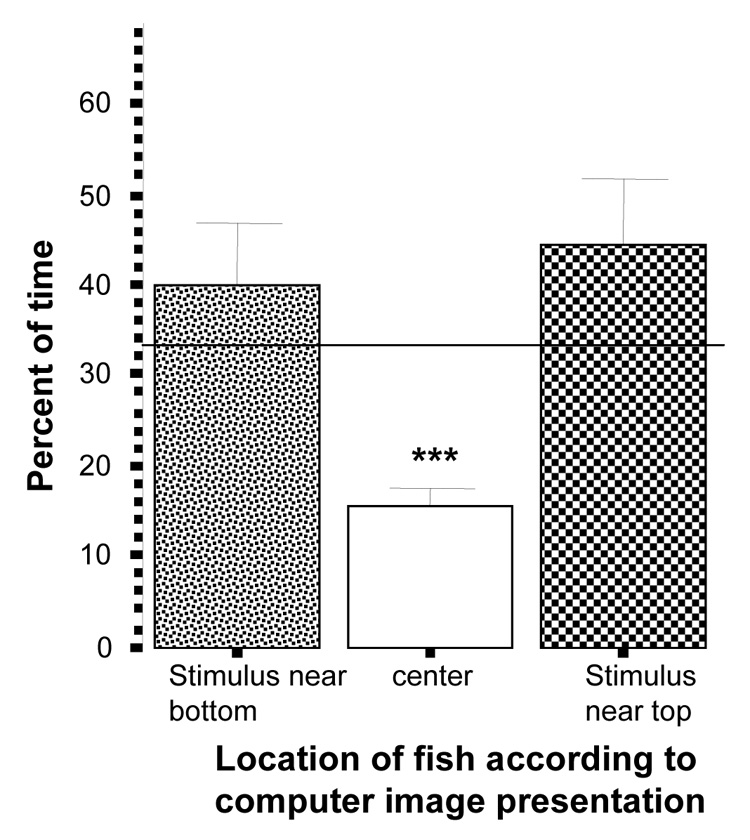
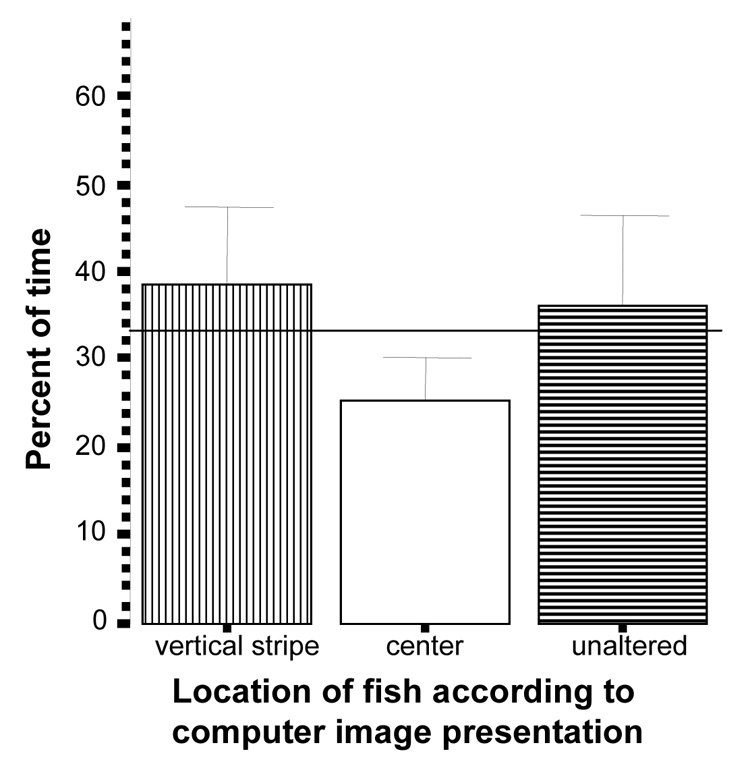
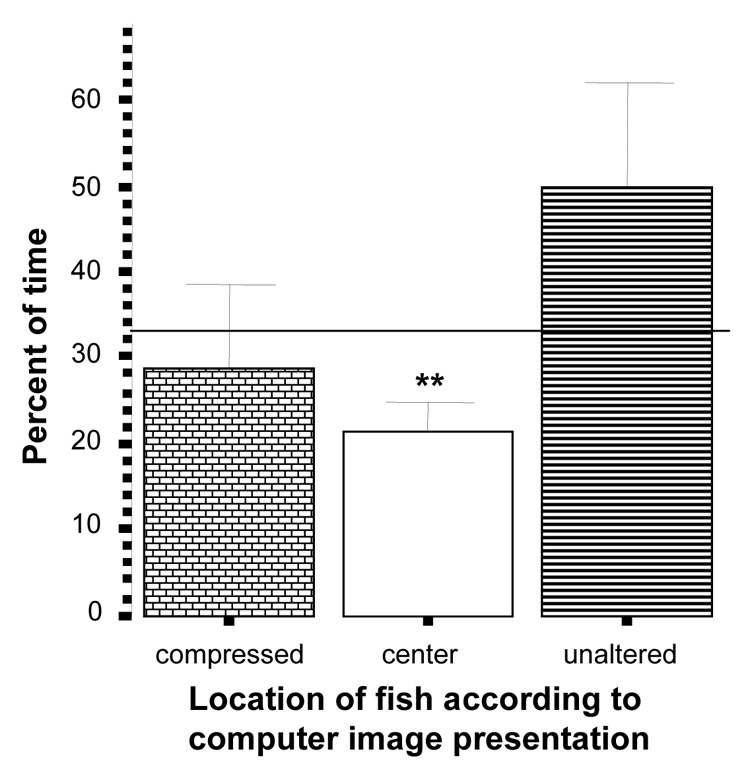
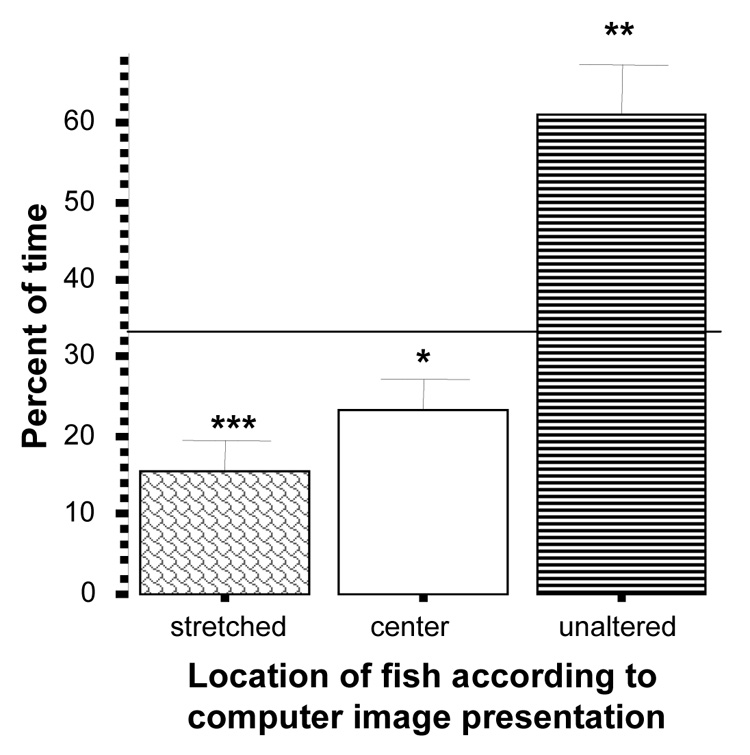
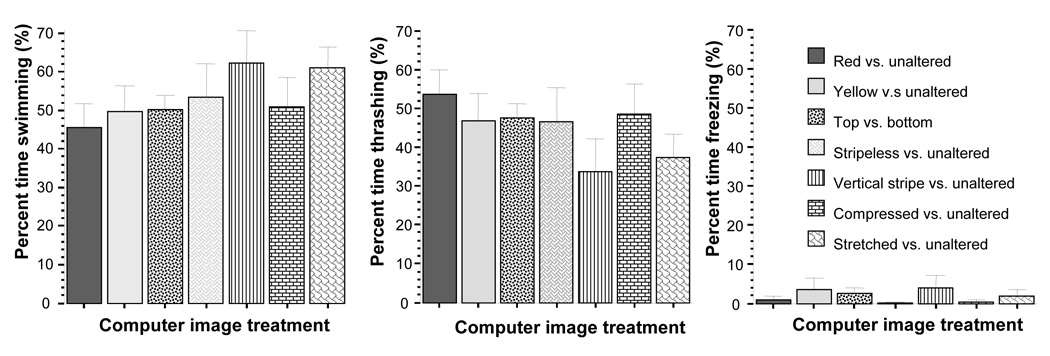
Zebrafish has been in the forefront of developmental biology and genetics, but only recently has interest in their behavior increased. Zebrafish are small and prolific, which lends this species to high throughput screening applications. A typical feature of zebrafish is its propensity to aggregate in groups, a behavior known as shoaling. Thus, zebrafish has been proposed as a possible model organism appropriate for the analysis of the genetics of vertebrate social behavior. However, shoaling behavior is not well characterized in zebrafish. Here, using a recently developed software application, we first investigate how zebrafish respond to conspecific and heterospecific fish species that differ in coloration and/or shoaling tendencies. We found that zebrafish shoaled with their own species but not with two heterospecific species, one of which was a shoaling the other a non-shoaling species. In addition, we have started the analysis of visual stimuli that zebrafish may utilize to determine whether to shoal with a fish or not. We systematically modified the color, the location, the pattern, and the body shape of computer animated zebrafish images and presented them to experimental zebrafish. The subjects responded differentially to some of these stimuli showing preference for yellow and avoidance of elongated zebrafish images. Our results suggest that computerized stimulus presentation and automated behavioral quantification of zebrafish responses are feasible, which in turn implies that high throughput forward genetic mutation or drug screening will be possible in the analysis of social behavior with this model organism.


Figures

Figure 1
Figure 1
Average distance between experimental zebrafish is significantly affected by stimulus condition. Mean ± S.E.M. are shown. Bars that share a letter designation are not significantly (p > 0.05) different. Panel A illustrates what was measured: the distances (straight lines connecting the light grey circles) between all pairs of experimental zebrafish (light grey circles). Panels A, B, and C are representative examples of distribution of fish: Experimental zebrafish (light grey circles, n=10) encountering (A) platys (black squares, n=10), (B) white cloud (dark grey squares, n=10), or (C) other wild type zebrafish (light grey squares, n=10, where ‘n’ represents the number of 5-fish shoals). Note the scattering of the platys on panel A. Also note the separate shoals the white cloud and experimental zebrafish formed shown on panel B. Last, note that the distances among experimental zebrafish were largest (panel C) when the stimulus fish they encountered were their conspecifics (wild type zebrafish or “gold” zebrafish). This was because experimental zebrafish distributed themselves among, i.e. shoaled with, the stimulus fish. For details of results of the statistical analysis, see Results section.
Figure 2
Figure 2
Average distance between stimulus fish significantly depends upon the species of stimulus fish. Mean ± S.E.M. are shown. Sample sizes are as in figure 1. Bars that share a letter designation are not significantly (p > 0.05) different. Panel A illustrates what was measured: the distances (straight lines connecting the black squares) between stimulus fish (black squares representing the platy in this case). Panels A, B, and C are the same representative examples of distribution of fish given on figure 1: Experimental zebrafish (light grey circles) encountering (A) platys (black squares), (B) white cloud (dark grey hatched squares), or (C) other wild type zebrafish (light grey striped squares). Note that platys showed a significantly increased distance among them compared to all other stimulus fish. For details of results of the statistical analysis, see Results section.
Figure 3
Figure 3
Average distance between stimulus fish and experimental zebrafish significantly depends upon the species of stimulus fish. Mean ± S.E.M. are shown. Sample sizes are as in figure 1. Bars that share a letter designation are not significantly (p > 0.05) different. Panel A illustrates what was measured: the distances (straight lines) between stimulus fish (black striped squares) and experimental zebrafish (grey circles). Panels A, B, and C are the same representative examples of distribution of fish given on figure 1: Experimental zebrafish (light grey circles) encountering (A) platys (black striped squares), (B) white cloud (dark grey hatched squares), or (C) other wild type zebrafish (light grey striped squares). Note that experimental zebrafish stayed farthest from platys less far from white cloud and least far from their own conspecifics (wild type or gold zebrafish). For details of results of the statistical analysis, see Results section.
Figure 4
Figure 4
Average distance between stimulus fish and experimental zebrafish across three intervals. Mean ± S.E.M. are shown for three time intervals: T1 = 60–90 sec, T2 = 300 – 330 sec, T3 = 570 – 600 sec (where 0 sec is the start of the recording session). Sample sizes are as in figure 1. Note that although a significant time effect was found suggesting an overall increase of distance, the time × stimulus treatment interaction was non-significant, i.e. the effect of stimulus treatment was independent of the time. For details of results of the statistical analysis, see Results section.
Figure 5
Figure 5
The photograph of an adult wild type zebrafish (A) was electronically modified to generate altered images in which body proportions (compressed (B) or stretched (C)), color (yellow (D) or red hue (E)), or stripe pattern (lack of stripes (F) or vertical stripes (G)) was manipulated. In each experiment animated (moving) images of five identically altered zebrafish were shown on one side of the experimental tank and moving images of five unaltered (wild type) zebrafish on the other. In addition, a set of five unaltered zebrafish images were also presented near the surface vs. near the bottom. For additional experimental details see Methods section.
Figure 6
Figure 6
Percent of time zebrafish spent near the red images side, the unaltered images side or the center of the tank. Mean ± S.E.M. are shown (n=10). Random chance (33%) is indicated by the horizontal line. Significant deviation from random chance is indicated by asterisks (*p < 0.05, **p<0.01, ***p<0.001). Note that although zebrafish did not avoid the red images, they showed a significant preference for the unaltered ones.
Figure 7
Figure 7
Percent of time zebrafish spent near the yellow images side, the unaltered images side or the center of the tank. Mean ± S.E.M. are shown (n=10). Random chance (33%) is indicated by the horizontal line. Significant deviation from random chance is indicated by asterisks (*p < 0.05, **p<0.01, ***p<0.001). Note that zebrafish showed a significant preference for the yellow images.
Figure 8
Figure 8
Percent of time zebrafish spent near the side where images were presented on the bottom, the side where the images were presented near the surface, or the center of the tank. Mean ± S.E.M. are shown (n=20). Random chance (33%) is indicated by the horizontal line. Significant deviation from random chance is indicated by asterisks (*p < 0.05, **p<0.01, ***p<0.001). Note that zebrafish showed neither preference for nor avoidance of either image side.
Figure 9
Figure 9
Percent of time zebrafishspent near the stripeless images side, the unaltered images side, or the center of the tank. Mean ± S.E.M. are shown (n=10). Random chance (33%) is indicated by the horizontal line. Significant deviation from random chance is indicated by asterisks (*p < 0.05, **p<0.01, ***p<0.001). Note that zebrafish showed neither preference for nor avoidance of either image side.
Figure 10
Figure 10
Percent of time zebrafish spent near the vertically striped images side, the unaltered images side, or the center of the tank. Mean ± S.E.M. are shown (n=10). Random chance (33%) is indicated by the horizontal line. Significant deviation from random chance is indicated by asterisks (*p < 0.05, **p<0.01, ***p<0.001). Note that zebrafish showed neither preference for nor avoidance of either image side.
Figure 11
Figure 11
Percent of time zebrafish spent near the compressed (“fat”) images side, the unaltered images side, or the center of the tank. Mean ± S.E.M. are shown (n=10). Random chance (33%) is indicated by the horizontal line. Significant deviation from random chance is indicated by asterisks (*p < 0.05, **p<0.01, ***p<0.001). Note that although the percent of time spent near the unalaterd side appears larger, zebrafish showed neither significant preference for nor avoidance of either image side.
Figure 12
Figure 12
Percent of time zebrafish spent near the stretched (“long skinny”) images side, the unaltered images side, or the center of the tank. Mean ± S.E.M. are shown (n=10). Random chance (33%) is indicated by the horizontal line. Significant deviation from random chance is indicated by asterisks (*p < 0.05, **p<0.01, ***p<0.001). Note that zebrafish spent significantly below chance proportion of time near the altered image and above chance proportion of time near the unaltered one.
Figure 13
Figure 13
Stimulus treatment had no significant effect on motor patterns Swimming, Thrashing, and Freezing. Mean ± S.E.M. are shown (n=10). Note that fish froze very little and spent most of their time actively swimming or thrashing (attempting to swim through the glass wall of their tank). Significant deviation from random chance is indicated by asterisks (*p < 0.05, **p<0.01, ***p<0.001)

Similar articles

Cited by

References

    1. Aickin M, Gensler H. Adjusting for multiple testing when reporting research results: The Bonferroni vs. Holm methods. American Journal of Public Health. 1996;86:726–728. - PMC - PubMed
    1. Allan JR, Pitcher TJ. Species segregation during predator evasion in cyprinid fish shoals. Freshwater Biology. 1986;16:653–659.
    1. Amsterdam A, Hopkins N. Mutagenesis strategies in zebrafish for identifying genes involved in development and disease. Trends Genet. 2006;22:473–478. - PubMed
    1. Barut BA, Zon LI. Realizing the potential of zebrafish as a model for human disease. Physiol Genomics. 2000;2:49–51. - PubMed
    1. Bass SLS, Gerlai R. Zebrafish (Danio rerio) responds differentially to stimulus fish: The effects of sympatric and allopatric predators and harmless fish. Behav Brain Res. 2007;186:107–117. - PubMed

Publication types