. 2008 Jul;57(7):1952-65.
doi: 10.2337/db07-1520. Epub 2008 Apr 16.

Hyperglycemia-induced reactive oxygen species toxicity to endothelial cells is dependent on paracrine mediators

Affiliations

Hyperglycemia-induced reactive oxygen species toxicity to endothelial cells is dependent on paracrine mediators

Julia V Busik et al. Diabetes. 2008 Jul.

Abstract

Objective: This study determined the effects of high glucose exposure and cytokine treatment on generation of reactive oxygen species (ROS) and activation of inflammatory and apoptotic pathways in human retinal endothelial cells (HRECs).

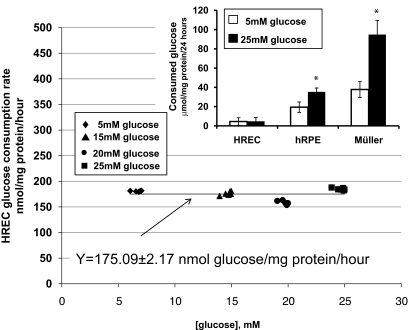
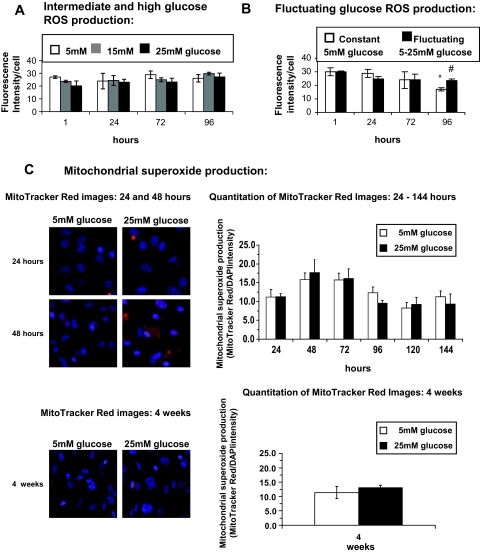
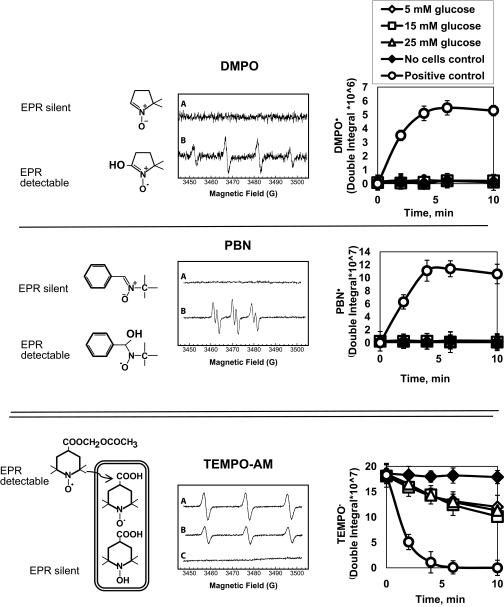
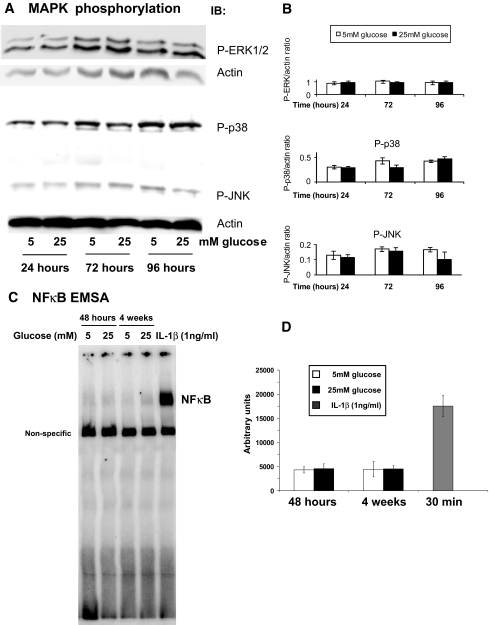
Research design and methods: Glucose consumption of HRECs, human retinal pigment epithelial cells (HRPEs), and human Müller cells (HMCs) under elevated glucose conditions was measured and compared with cytokine treatment. Production of ROS in HRECs was examined using 5-(and-6)-chloromethyl-2',7'-dichlorodihydrofluorescein diacetate (CM-H(2)DCFDA), spin-trap electron paramagnetic resonance, and MitoTracker Red staining after high glucose and cytokine treatment. The activation of different signaling cascades, including the mitogen-activated protein kinase pathways, tyrosine phosphorylation pathways, and apoptosis by high glucose and cytokines in HRECs, was determined.

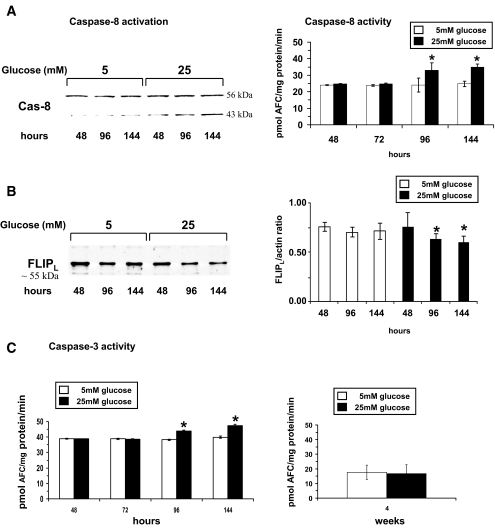
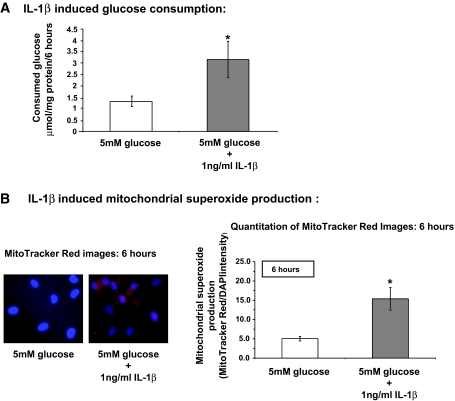
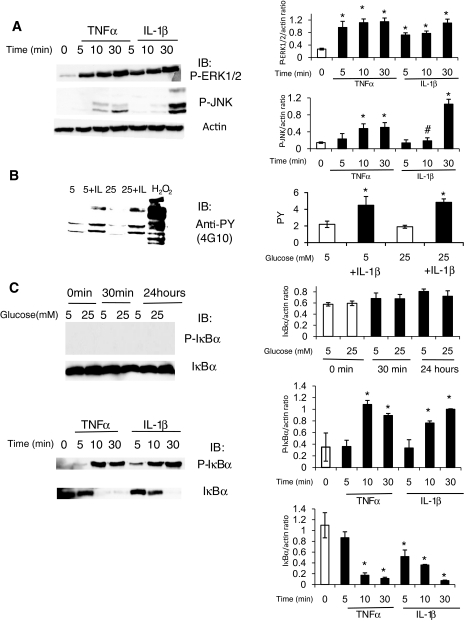
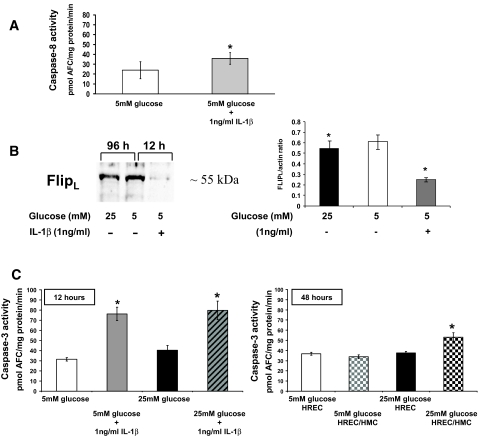
Results: HRECs, in contrast to HRPEs and HMCs, did not increase glucose consumption in response to increasing glucose concentrations. Exposure of HRECs to 25 mmol/l glucose did not stimulate endogenous ROS production, activation of nuclear factor-kappaB (NF-kappaB), extracellular signal-related kinase (ERK), p38 and Jun NH(2)-terminal kinase (JNK), tyrosine phosphorylation, interleukin (IL)-1beta, or tumor necrosis factor-alpha (TNF-alpha) production and only slightly affected apoptotic cell death pathways compared with normal glucose (5 mmol/l). In marked contrast, exposure of HRECs to proinflammatory cytokines IL-1beta or TNF-alpha increased glucose consumption, mitochondrial superoxide production, ERK and JNK phosphorylation, tyrosine phosphorylation, NF-kappaB activation, and caspase activation.

Conclusions: Our in vitro results indicate that HRECs respond to cytokines rather than high glucose, suggesting that in vivo diabetes-related endothelial injury in the retina may be due to glucose-induced cytokine release by other retinal cells and not a direct effect of high glucose.


Figures

FIG. 1.
FIG. 1.
Rate of glucose consumption in endothelial cells is not dependent on glucose concentration in media. Confluent plates of HRECs were cultured in 5 mmol/l (♦), 15 mmol/l (▴), 20 mmol/l (•), or 25 mmol/l (▪) glucose for 2, 4, 8, 16, 32, and 64 h. HRECs, HRPEs, and HMCs were cultured in 5 mmol/l (white bars) or 25 mmol/l (black bars) glucose for 24 h (inset). Glucose consumption was determined as a rate of decrease in glucose concentration in the media normalized to total cellular protein and plotted against glucose concentration in the media. Nonlinear least squares regression analysis demonstrated that the dependency can be best fitted by the equation Y = 175.09 ± 2.17 nmol glucose · mg−1 protein · h−1 with correlation coefficiency of 0.927, describing a zero-order kinetics reaction. As presented in the inset, HRECs consumed extremely low amounts of glucose compared with HRPEs and HMCs, and there was no increase in glucose consumption in HRECs cultured in 25 mmol/l glucose unlike in the HRPE and HMC cultures. Results represent means ± SD; n = 3 for HRPEs, 4 for HMCs, and 6 for HRECs; *P < 0.05.
FIG. 2.
FIG. 2.
Measurements of oxidative stress in high glucose–treated HREC fluorescent ROS indicators do not show production of oxidative radicals. CM-H2DCFDA fluorescent ROS indicator measurements were performed on HRECs treated with increasing glucose concentrations (5, 15, and 25 mmol/l) (n = 3) (A) or on HRECs treated with fluctuating glucose concentrations (B). The fluorescence intensity was normalized to cell number in normal 5 mmol/l glucose (white bars) or fluctuating 5–25 mmol/l glucose every 12 h for the times indicated (black bars). Results of nine independent experiments (means ± SD) are shown. *P < 0.01 compared with 5 mmol/l glucose at 1, 24, and 72 h (white bars). #P < 0.01 25 mmol/l glucose compared with 5 mmol/l glucose at 96 h. C: HRECs were incubated in medium containing 5 or 25 mmol/l glucose for times indicated. Mitochondrial superoxide production was measured as described in research design and methods using MitoTrackerRed, a dye that accumulates in the mitochondria and becomes fluorescent upon reaction with superoxide radicals. Results are presented as the mean ± SD (MitoTracker Red/DAPI intensity; n = 6). At time points indicated, representative fluorescent images (×40 objectives) of MitoTracker Red and DAPI overlay are shown on the left.
FIG. 3.
FIG. 3.
Measurements of oxidative stress in high glucose–treated HRECs using spin trap EPR do not show production of oxidative radicals. Spin-trap EPR was used to confirm the failure of high glucose to increase endogenous ROS production by HRECs. HRECs were cultured in matrix-coated Teflon tubes. In each experiment, the cells were incubated for 1–72 h in 5 (⋄), 15 (□), or 25 (▵) mmol/l glucose, and production of radicals was measured. Twenty-four–hour time point is shown; DMPO (top), PBN (middle) or TEMPO-AM (bottom) was used. The principle of detection is shown on the left, representative EPR traces in the middle, and quantitated data on the right. Cells stimulated with 0.5 mmol/l H2O2 in the presence of iron to induce Fenton's reaction served as positive controls (○). Teflon tubes without cells were used as negative controls (♦). Top and middle: Traces A for DMPO and PBN are from 25 mmol/l glucose-stimulated cells. No cells control and 5 and 15 mmol/l glucose traces looked similar to 25 mmol/l glucose trace. Traces B for DMPO and PBN are from the positive control. In DMPO and PBN experiments, exposure to 15 and 25 mmol/l glucose did not cause detectable radical production; no cells control (♦), 5 (⋄), 15 (□), or 25 (▵) mmol/l glucose graphs are super-imposable in the top and middle panels. Only when the cells were stimulated with H2O2 was radical production observed (○). Bottom: TEMPO-AM is more sensitive than DMPO and PBN and is hydrolyzed inside the cell, retained in the cytoplasm, and then reduced to the corresponding hydroxylamine, leading to the loss of paramagnetism. Loss of EPR signal corresponds to the amount of intracellular free radicals. HRECs were incubated for 1–96 h in the varying glucose concentrations, and then TEMPO-AM was added. HRECs exposed to 5 (⋄), 15 (□), or 25 (▵) mmol/l glucose for 24 h all demonstrated a low level of radicals, and there was no difference in radical production between different glucose concentrations. Trace A for TEMPO-AM is from no cell control with no loss of paramagnetism; trace B is from 25 mmol/l glucose; 5 and 15 mmol/l glucose traces looked similar to 25 mmol/l glucose; trace C is from positive control with radical production being detected as a loss of paramagnetism. Results of five independent experiments (mean ± SD) are shown in the graphs.
FIG. 4.
FIG. 4.
High glucose does not lead to MAPK phosphorylation and NF-κB activation in HRECs. HRECs were incubated in either 5 or 25 mmol/l glucose for designated time periods. Immunoblot analyses using anti–phospho-ERK1/2, anti–phospho p38, and anti–phospho JNK antibodies was performed. Equal amounts of protein were added to each lane as confirmed by actin levels. Exposure to high glucose (25 mmol/l) for 24, 72, and 96 h did not affect phosphorylation status of ERK1/2, p38, or JNK MAPKs. Representative results from at least three independent experiments are shown in the left (A). Densitometry analysis of Western blots (normalized to actin, n = 3) are presented as mean ± SD in B. C: NF-κB EMSA gel shift assays were performed on HRECs treated with 5 or 25 mmol/l glucose for times indicated. IL-1β (1 ng/ml) treatments served as positive controls. Representative image of NF-κB gel shift is show in C; densitometry analysis of three independent EMSA assays is shown in D.
FIG. 5.
FIG. 5.
High glucose induces slight activation of proapoptotic caspase signaling pathways in short-term but not in long-term treatments. A: HRECs were incubated in medium containing 5 or 25 mmol/l glucose. Activities of caspase-8, the only initiator caspase that became activated, are presented as means ± SD (n = 8) with *P < 0.05 significantly different from normal glucose. Western blot analyses were done to confirm activation of caspase-8 by determining cleavage of caspase-8 protein over time in high glucose (25 mmol/l)–treated HRECs compared with control cells (55-kDa full-length caspase-8 protein, 43-kDa cleaved fragment). This Western blot is representative of eight independent experiments. B: In HRECs, the c-FLIPL (or α-isoform) (∼55 kDa) is the dominant isoform of this family of caspase-8 signaling regulator and apoptosis inhibitor. Western blot analysis showed that HRECs have high levels of c-FLIPL protein (55 kDa), and high glucose (25 mmol/l) treatment induces loss of c-FLIPL. This Western blot is representative of three independent experiments. Densitometry analysis of the Western blots is presented as the mean ± SD of the c-FlipL–to–actin ratio (n = 3) with *P < 0.05 significantly different from normal glucose. C: Caspase-3 activity showed a slight but significant increase over time by 15 ± 0.5 and 18 ± 0.5% at 96 and 144 h, respectively, compared with control. At 4 weeks of high glucose treatment, no significant changes in caspase-3 activity were detectable. Activities of caspase-3 are presented as means ± SD (n = 8) with *P < 0.05 significantly different from normal glucose.
FIG. 6.
FIG. 6.
IL-1β increases glucose consumption and subsequent mitochondrial superoxide production in HRECs. A: HRECs were incubated in medium containing 5 mmol/l glucose (white bar) or 5 mmol/l glucose + 1 ng/ml IL-1β (black bar) for 6 h, and glucose consumption was measured as described in research design and methods. Results are presented as the mean ± SD; n = 5, *P < 0.05. B: HRECs were incubated in medium containing 5 mmol/l glucose or 5 mmol/l glucose + 1 ng/ml IL-1 β for 6 h. Mitochondrial superoxide production was measured as described in research design and methods. Results are presented as the mean ± SD (MitoTracker Red/DAPI intensity; n = 6) with *P < 0.05 significantly different from normal glucose. Representative fluorescent images (×40 objectives) of MitoTracker Red and DAPI overlay are shown on the left.
FIG. 7.
FIG. 7.
Cytokines, but not high glucose conditions, induce MAPK phosphorylation, tyrosine phosphorylation, and IκBα phosphorylation and degradation in HRECs. A: Since high glucose conditions did not activate or stimulate HRECs, the direct effects of TNF-α and IL-1β on HRECs were tested. HRECs were serum starved overnight and stimulated with 5 ng/ml TNF-α or 1 ng/ml IL-1β for different time periods as indicated. The activation of ERK and JNK signaling pathways was assessed by immunoblot analyses using anti–phospho-ERK1/2 and anti–phospho JNK antibodies as indicated. Equal amounts of protein were added to each lane as confirmed by actin levels. Both cytokines induced marked ERK1/2 and JNK phosphorylation. Representative results from at least three independent experiments are shown on the left and quantified and presented as means ± SD on the right. *P < 0.01 compared with control. B: Tyrosine phosphorylation in HRECs was assessed by immunoblot using anti-phospho-tyrosine antibody after treatment with high glucose for 0.5–78 h with or without IL-1β (1 ng/ml). Stimulation for 10 min with either 0.5 mmol/l H2O2 (positive control) or 1 ng/ml IL-1β led to a marked increase in tyrosine-phosphorylated proteins. Twenty-four–hour exposure data are shown; similar results were obtained for 0.5- to 78-h time points. C: The effects of high glucose (top) conditions, TNF-α, and IL-1β (bottom image) on IκBα phosphorylation and degradation, the first step in NF-κB pathway activation, were examined in HRECs. High glucose had no effect, whereas 5 ng/ml TNF-α or 1 ng/ml IL-1β for 0–30 min led to a dramatic increase in IκBα phosphorylation and degradation. Representative results from at least three independent experiments are shown on the left and quantified and presented as means ± SD on the right. *P < 0.01 compared with control.
FIG. 8.
FIG. 8.
IL-1β induces activation of caspase-8 and -3, and loss of protective c-FLIPL in HRECs. A: HRECs were incubated in medium containing 5 mmol/l glucose or 1 ng/ml IL-1β for 12 h. Activities of caspase-8 were measured and presented as means ± SD (n = 6) with *P < 0.05 significantly different from normal glucose. B: IL-1β strongly decreased protein levels of pro-survival c-FLIPL within 12 h compared with 96 h incubation in 25 mmol/l glucose and control as shown by Western blot analysis in HRECs. The Western blot is representative of three independent experiments. Densitometry analysis of the Western blots is presented as the mean ± SD of the c-FlipL–to–actin ratio (n = 3) with *P < 0.05 significantly different from normal glucose. C: HRECs were treated in 5 or 25 mmol/l glucose in the presence or absence of IL-1β (1 ng/ml) for 12 h, and caspase-3 activities were measured (left). High glucose did not influence caspase-3 activity in a synergistic manner. Caspase-3 activities are presented as means ± SD (n = 6) with *P < 0.05 significantly different from normal glucose. HRECs were cultured alone or in co-culture with HMCs in 5 or 25 mmol/l glucose for 48 h as described in research design and [scap]methods (right). Caspase-3 activities of HRECs either cultured alone or in HREC/HMC co-culture were measured and presented as means ± SD (n = 6) with *P < 0.05 compared with HRECs treated in 5 mmol/l glucose.

Similar articles

Cited by

References

    1. Baynes JW: Role of oxidative stress in development of complications in diabetes. Diabetes 40 :405 –412,1991 - PubMed
    1. Koya D, King GL: Protein kinase C activation and the development of diabetic complications. Diabetes 47 :859 –866,1998 - PubMed
    1. Vinores SA, Campochiaro PA, Williams EH, May EE, Green WR, Sorenson RL: Aldose reductase expression in human diabetic retina and retinal pigment epithelium. Diabetes 37 :1658 –1664,1988 - PubMed
    1. Brownlee M: Lilly Lecture 1993: Glycation and diabetic complications. Diabetes 43 :836 –841,1994 - PubMed
    1. Tilton RG, Kawamura T, Chang KC, Ido Y, Bjercke RJ, Stephan CC, Brock TA, Williamson JR: Vascular dysfunction induced by elevated glucose levels in rats is mediated by vascular endothelial growth factor. J Clin Invest 99 :2192 –2202,1997 - PMC - PubMed

Publication types

MeSH terms