. 2008:4:180.
doi: 10.1038/msb.2008.19. Epub 2008 Apr 15.

A map of human protein interactions derived from co-expression of human mRNAs and their orthologs

Affiliations

A map of human protein interactions derived from co-expression of human mRNAs and their orthologs

Arun K Ramani et al. Mol Syst Biol. 2008.

Abstract

The human protein interaction network will offer global insights into the molecular organization of cells and provide a framework for modeling human disease, but the network's large scale demands new approaches. We report a set of 7000 physical associations among human proteins inferred from indirect evidence: the comparison of human mRNA co-expression patterns with those of orthologous genes in five other eukaryotes, which we demonstrate identifies proteins in the same physical complexes. To evaluate the accuracy of the predicted physical associations, we apply quantitative mass spectrometry shotgun proteomics to measure elution profiles of 3013 human proteins during native biochemical fractionation, demonstrating systematically that putative interaction partners tend to co-sediment. We further validate uncharacterized proteins implicated by the associations in ribosome biogenesis, including WBSCR20C, associated with Williams-Beuren syndrome. This meta-analysis therefore exploits non-protein-based data, but successfully predicts associations, including 5589 novel human physical protein associations, with measured accuracies of 54+/-10%, comparable to direct large-scale interaction assays. The new associations' derivation from conserved in vivo phenomena argues strongly for their biological relevance.


Figures
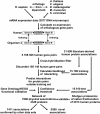
Figure 1
Figure 1
Overview of the analysis. From gene expression data for pairs of human genes and their orthologs, we identify proteins most likely to physically associate. For each pair of human genes, we compare the correlation in their mRNA expression patterns with the correlation in expression of their corresponding ortholog pairs, searching for patterns of conserved co-expression strongly enriched among physically associated proteins. By filtering the data to remove spurious associations (e.g. from microarray cross-hybridization and non-conserved expression regulation) and testing the associations against known human protein interactions and annotations, we predict 7000 human physical protein associations.
Figure 2
Figure 2
Predicting physically associated proteins from patterns of conserved co-expression. (A) Distribution of mRNA co-expression patterns of 1769 pairs of proteins that physically associate; (B) the distribution of co-expression patterns of 642 295 protein pairs that are not known to physically associate. By comparing the two distributions, we identify patterns that indicate the tendency to physically associate. In all panels, the x axis indicates the correlation of mRNA expression profiles of human gene pairs and the y axis the expression correlation of corresponding ortholog pairs in C. elegans. In (A, B), the z axis (represented as contours from purple (low) to red (high); white indicates zero) indicates the fraction of human gene pairs in either the true-positive (A) or -negative (B) set having a correlation ‘x' with C. elegans orthologs having a correlation ‘y'. (C) Log likelihood that human protein pairs with a given conserved co-expression pattern will physically interact, calculated as the logarithm of the ratio of the two distributions, corrected by prior expectation, and ranging from blue (negative) to red (positive) is plotted; white indicates zero. Contours are labeled with values of the log likelihood score.
Figure 3
Figure 3
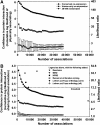
Two measurements of the quality of the derived physical protein associations. (A) The cumulative log likelihood ratio (LLR) of physically associating, measured with an independent test set of 15 810 human protein physical associations, plotted as a function of the number of associations. The CCE associations are significantly more enriched for known physical associations than randomized protein pairs or those derived only from human mRNA co-expression. The left y axis indicates the LLR score for the associations based on comparison to the known interaction test set; the right y axis indicates the corresponding likelihood ratio. Associations were ranked by confidence (see Materials and methods) and binned into sets of 1000 associations per bin for analysis. (B) The tendency for putative interaction partners to participate in the same pathway. The left y axis indicates the cumulative LLR (and the right y axis the corresponding likelihood ratio) for interaction partners to belong to the same pathway, using the same log likelihood framework as in (A), but employing as a positive test set the ∼1.5 million human protein pairs defined in the GO and KEGG databases as belonging to the same pathway. As in (A), CCE associations are comparable in quality to literature associations and score significantly higher than randomized associations and those derived using only human expression data.
Figure 4
Figure 4
Mass spectrometry evidence for physical associations among 3013 proteins identified from HeLa cells. (A) HeLa cells were lysed under native conditions that maintained protein complexes intact, the nuclei/mitochondria were separated from the cytoplasm, and the two were fractionated by sucrose density gradient ultracentrifugation, collecting 14 fractions from each of the two gradients. Each fraction was analyzed by quantitative shotgun proteomics, resulting in an elution profile for each of 3013 proteins across the gradients. Proteins in the same physical complex tend to exhibit correlated elution profiles, as shown in (B) for major complexes following hierarchical clustering of the proteins by their elution profiles (labeling several sets of proteins notably enriched for interaction partners from the indicated pathways), and in (C) for three specific examples of known protein complexes. Abundance in (B) is calculated as the frequency of MS/MS spectral counts in a given fraction per protein × 10 000. Examples in (C) are labeled with the average pairwise Pearson correlation coefficient (< r >) among the profiles.
Figure 5
Figure 5
Enrichment of known complexes among co-eluting proteins. Proteins co-eluting across both sucrose gradient experiments are highly likely to belong to the same physical complex, as demonstrated by considering the subset of proteins in known human protein complexes (from Reactome; Joshi-Tope et al, 2005) that are also identified in the mass spectrometry experiments, then calculating the percentage of these protein pairs belonging to the same Reactome complex as a function of the correlation in their elution profiles. With increasing correlation, we observe strongly increasing probability of belonging to the same physical protein complex. Proteins with the most correlated elution profiles across the 28 experiments are ∼40% likely to belong to the same protein complex.
Figure 6
Figure 6
Validation of the CCE associations by mass spectrometry. (A) Between 49 and 59% of the 7000 CCE associations correspond to true physical associations, as estimated with shotgun proteomics elution profiles. The extent of co-elution of positive control (literature; Joshi-Tope et al, 2005), negative control (random), and CCE associations were calculated as the Pearson correlation coefficients between interaction partners' elution profiles, defining a correlation coefficient histogram for each set of associations. The proportion of true positives in the 7000 CCE associations was estimated by fitting the CCE correlation coefficient histogram as a linear mixture of the control histograms, with the true-positive rate corresponding to the percentage of the positive control histogram providing the best fit (inset). (B) Specific examples of correlated elution profiles for CCE partners, supporting the physical association of these protein pairs.
Figure 7
Figure 7
Three additional estimates of the proportion of true physical associations in the CCE pairs. (A) Overview of the method: 500 control sets of 7000 associations each (filled circles), composed of varying (but known) proportions of true-positive and true-negative associations, were tested either for overlap with orthologous protein interactions (in B) or for sharing of functional annotation (in C), generating a standard curve. From this curve and similar measurements on the CCE associations, the percentage of true physical associations can be estimated. (B) Accuracy estimates from comparison to physical protein interactions between orthologous protein pairs measured in model organisms. A standard curve that relates an interaction set's enrichment with orthologous interactions to its percentage of true-positive physical associations was constructed by measuring the Jaccard coefficients between control sets of known proportions of positive (Joshi-Tope et al, 2005) and negative (random) physical associations and an independent set of physical interactions derived from yeast (Ito et al, 2000, 2001; Uetz et al, 2000; Ho et al, 2002; Gavin et al, 2006; Krogan et al, 2006), C. elegans (Li et al, 2004), and fly (Giot et al, 2003). From this curve and the overlap measured for the CCE associations, we estimated that 37–41% of the CCE associations correspond to true physical associations, considerably higher than for randomized sets of the 7000 interactions (plotted as the mean of 10 trials) and the top 7000 associations were derived using only human mRNA expression data. (C) A standard curve based on overlap of SwissProt keywords suggests that 59–68% of CCE associations correspond to physical associations. (D) Accuracy was estimated from comparison to a probabilistic yeast gene network (Lee et al, 2007). The distances between yeast orthologs of interacting human proteins were measured in the yeast network as the minimum number of interactions separating each pair of proteins. The resulting histogram of distances is plotted for each association set tested and for positive and negative control sets. Note that the distribution from CCE associations resembles the positive control set. The percentage of true and false positives in the CCE associations was estimated by fitting the distribution as a linear mixture of the positive and negative distributions (inset), minimizing the least squares criterion (r.m.s.d.; root mean square deviation); 63±3% of the 7000 CCE associations correspond to true physical associations by this test. Shuffling the interactions among the same proteins lowers the accuracy to 6±3% by this test. Error bars on the randomized association set indicate ±1 s.d. for N=10 random trials.
Figure 8
Figure 8
Experimental evidence supporting the network-based association of four proteins with ribosome biogenesis. (A) Co-sedimentation of TAP-tagged proteins (Ghaemmaghami et al, 2003) with ribosomal subunits. (Top) An extract of wild-type yeast cells was fractionated on a 7–47% sucrose gradient, monitoring absorbance at 254 nm. Labeled peaks indicate the 40S and 60S subunits, 80S monoribosomes, and polysomes. (bottom) Immunoblots of sucrose gradient fractions indicate the distributions of TAP-tagged proteins. YNL022C and YCR087C-A co-sediment with 60S, and both 40S and 60S ribosomal subunits, respectively, as can be seen by comparison with the sedimentation of Tsr1p-TAP, known to associate with 40S subunits (Gelperin et al, 2001), and Nmd3p-TAP, known to associate with 60S subunits (Ho and Johnson, 1999), as well as by contrast to the sedimentation of the unrelated negative control protein Tdh1p-TAP and with the background signal from wild-type cells lacking TAP-tagged proteins. Bcp1p co-sediments with 40S and 60S subunits to a lesser extent than the controls; however, this behavior apparently stems from destabilization of the protein by the TAP tag, as shown in (B). (B) Polysome profiles of cells depleted (by doxycycline-controlled downregulation; Mnaimneh et al, 2004) for Bcp1p or of cells expressing Bcp1p-TAP both show increased 40S/60S ratios and formation of aberrant ribosome halfmers (black arrows), implicating Bcp1p in 60S subunit biogenesis. (C) Polysome profiles of cells depleted for YHR020W show diminished 40S peaks and polysome peaks after doxycycline incubation (+DOX), suggesting participation of YHR020W in 40S biogenesis and possibly translation initiation.
Figure 9
Figure 9
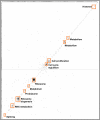
The 7000 associations discovered by CCE. The data are plotted as a matrix showing associations (filled entries) among 2348 proteins (rows and columns) after hierarchically clustering (Eisen et al, 1998) proteins by their association vectors. Clustering of proteins into complexes is clear in the marked boxes. The majority of associations are distributed among smaller clusters of proteins, with many occurring between pairs of proteins not participating in larger cliques. Clusters were drawn with TreeView (Eisen et al, 1998).

Similar articles

Cited by

References

    1. Ashburner M, Ball CA, Blake JA, Botstein D, Butler H, Cherry JM, Davis AP, Dolinski K, Dwight SS, Eppig JT, Harris MA, Hill DP, Issel-Tarver L, Kasarskis A, Lewis S, Matese JC, Richardson JE, Ringwald M, Rubin GM, Sherlock G (2000) Gene ontology: tool for the unification of biology. The Gene Ontology Consortium. Nat Genet 25: 25–29 - PMC - PubMed
    1. Audhya A, Emr SD (2003) Regulation of PI4,5P2 synthesis by nuclear–cytoplasmic shuttling of the Mss4 lipid kinase. EMBO J 22: 4223–4236 - PMC - PubMed
    1. Bader GD, Betel D, Hogue CW (2003) BIND: the biomolecular interaction network database. Nucleic Acids Res 31: 248–250 - PMC - PubMed
    1. Baim SB, Pietras DF, Eustice DC, Sherman F (1985) A mutation allowing an mRNA secondary structure diminishes translation of Saccharomyces cerevisiae iso-1-cytochrome c. Mol Cell Biol 5: 1839–1846 - PMC - PubMed
    1. Ball CA, Awad IA, Demeter J, Gollub J, Hebert JM, Hernandez-Boussard T, Jin H, Matese JC, Nitzberg M, Wymore F, Zachariah ZK, Brown PO, Sherlock G (2005) The Stanford Microarray Database accommodates additional microarray platforms and data formats. Nucleic Acids Res 33: (Database issue) D580–D582 - PMC - PubMed

Publication types