. 2008 Apr 15:2:34.
doi: 10.1186/1752-0509-2-34.

Using genetic markers to orient the edges in quantitative trait networks: the NEO software

Affiliations

Using genetic markers to orient the edges in quantitative trait networks: the NEO software

Jason E Aten et al. BMC Syst Biol. .

Abstract

Background: Systems genetic studies have been used to identify genetic loci that affect transcript abundances and clinical traits such as body weight. The pairwise correlations between gene expression traits and/or clinical traits can be used to define undirected trait networks. Several authors have argued that genetic markers (e.g expression quantitative trait loci, eQTLs) can serve as causal anchors for orienting the edges of a trait network. The availability of hundreds of thousands of genetic markers poses new challenges: how to relate (anchor) traits to multiple genetic markers, how to score the genetic evidence in favor of an edge orientation, and how to weigh the information from multiple markers.

Results: We develop and implement Network Edge Orienting (NEO) methods and software that address the challenges of inferring unconfounded and directed gene networks from microarray-derived gene expression data by integrating mRNA levels with genetic marker data and Structural Equation Model (SEM) comparisons. The NEO software implements several manual and automatic methods for incorporating genetic information to anchor traits. The networks are oriented by considering each edge separately, thus reducing error propagation. To summarize the genetic evidence in favor of a given edge orientation, we propose Local SEM-based Edge Orienting (LEO) scores that compare the fit of several competing causal graphs. SEM fitting indices allow the user to assess local and overall model fit. The NEO software allows the user to carry out a robustness analysis with regard to genetic marker selection. We demonstrate the utility of NEO by recovering known causal relationships in the sterol homeostasis pathway using liver gene expression data from an F2 mouse cross. Further, we use NEO to study the relationship between a disease gene and a biologically important gene co-expression module in liver tissue.

Conclusion: The NEO software can be used to orient the edges of gene co-expression networks or quantitative trait networks if the edges can be anchored to genetic marker data. R software tutorials, data, and supplementary material can be downloaded from: http://www.genetics.ucla.edu/labs/horvath/aten/NEO.


Figures

Figure 1
Figure 1
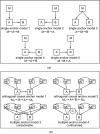
Approaches for genetic marker-based causal inference. Here we contrast different approaches for causality testing based on genetic markers. (a) single marker edge orienting involving a candidate pleiotropic anchor (CPA) M. The upper half of (a) shows the starting point of network edge orienting based on a single genetic marker M which is associated with traits A and B. The undirected edge between A and B indicates a significant correlation cor(A, B) between the two traits. The causal model in the lower half of (a) implies the following relationship between the correlation coefficients cor(M, B) = cor(M, A) × cor(A, B). Further it implies that the absolute value of the correlations |cor(M, A)| and |cor(M, B)| are high whereas the partial correlation |cor(M, B|A)| (Eq. 1) is low. Figure (b) generalizes the single marker situation to the case of multiple genetic markers MA={MA(1),MA(2),...}. In this case, it is straightforward to generalize single edge orienting scores to multi-marker scores. Figure (c) describes a situation when a set of genetic markers MB={MB(1),MB(2),...} is also available for trait B. We refer to the MB markers as orthogonal causal anchors (OCA) since cor(A,MB(j)) is expected to be 0 under the causal model MA A B MB, the correlation. Using simulation studies, we find that edge scores based on OCAs can be more powerful than those based on CPAs (see Additional File 1).
Figure 2
Figure 2
Illustrating the single genetic marker versus multi-marker local SEMs used in the definition of the LEO.NB score. The single genetic marker is denoted by M in (a) and the multiple genetic markers are denoted by MA(i) and MB(j) in (b) and (c). By definition, LEO.NB(A˃B) = log10{P (model 1)}/{maxi>1{P (model i)}} for a candidate A B edge orientation, where the models in the definition are pictured in (a) for single marker LEO.NB scores, and in (b) for multiple marker LEO.NB scores. In (b) we show the orthomarker models used for the LEO.NB.OCA marker aggregation method. The hidden confounder C in model 4 is the causal parent of both A and B, i.e. A C B. The simulation studies in Additional File 1 show that the LEO.NB.OCA score can be significantly more powerful than the LEO.NB.CPA score.
Figure 3
Figure 3
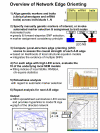
Overview of the network edge orienting method. The steps of the network overview analysis are described in the text.
Figure 4
Figure 4
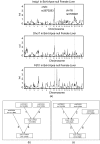
Manual SNP selection to study Insig1 → Dhrc7 and Insig1 → Fdft1 in mouse liver. Using female liver gene expression data and SNP markers from the BxH mouse intercross, NEO retrieves known causal relationships in the cholesterol biosynthesis pathway: Insig1 → Dhrc7 and Insig1 → Fdft1. The single marker LOD score curves in (a) motivate our choice of manually selected SNPs (one SNP on chromosome 16 and another on chromosome 8). These SNP markers can also be used to screen for genes that are reactive to Insig1, see Table 2. Figures (b) and (c) show the causal models used to compute the model p-values in favor of edge orientations Insig1 → Dhcr7 and Insig1 → Fdft1, respectively. More details on the individual edges are presented in Table 1.
Figure 5
Figure 5
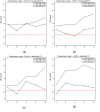
Automatic SNP selection to score Insig1 → Dhrc7 and Insig1 → Fdft1 in female and male mouse livers. These robustness plots show how the LEO.NB scores (y-axis) depend on sets of automatically selected SNP markers (x-axis). Here we use the default SNP selection method: combined greedy and forward stepwise method. Step K corresponds to choosing the top K greedy and top K forward selected SNPs for each trait. Since the greedy and the forward SNP selection may select the same SNPs, step K typically involves fewer than 2K SNPs per trait. Figures (a, b, top row) and (c, d) correspond to female and male BxH mice, respectively. Figures (a) and (c) report the results for edge Insig1 → Dhrc7 in female and male mouse livers, respectively. Figures (b) and (d) report the analogous results for Insig1 → Fdft1. NEO robustly retrieves the known causal relationship between these genes.
Figure 6
Figure 6
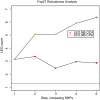
Fsp27 is a causal driver of a biologically important co-expression module. Prior work using mouse liver expression data found the 'blue' co-expression module to be biologically important [7]. Here we used automatic SNP selection to determine whether Fsp27 is causal of the blue module gene expression profiles. The expression profiles of the blue module were summarized by their first principal component (referred to as module eigengene). The blue module eigengene MEblue can be considered as the most representative gene expression profile of the blue module. The figure shows the results of a robustness analysis regarding LEO.NB(Fsp27 → MEblue) (y-axis) with respect to different choices of genetic markers sets (x-axis). Both LEO.NB.CPA and LEO.NB.OCA scores show that the relationship is causal, i.e. the Fsp27 is upstream of the blue module expressions.
Figure 7
Figure 7
Multi-edge simulation study involving 5 gene expression traits (E1-E5) and one clinical trait Trait. The heatmap plot in (a) depicts the true causal model. Note that a red square in the i-th row and j-th column indicates that trait i causally affects trait j, e.g. E1 → E2. The rows and columns of the heatmap are ordered according to a hierarchical clustering tree, which was constructed using average linkage hierarchical clustering based on the pairwise correlations of the traits. Figure (b) depicts the corresponding heatmap of the observed network that was reconstructed using the LEO.NB.OCA score. Figure (c) shows an alternative output graph of NEO. Blue edges indicate significant correlations and a LEO.NB.OCA score is added to each edges whose LEO.NB.OCA score passes a user-supplied threshold. We find that all true causal edges are correctly retrieved at the recommended LEO.NB.OCA threshold of 0.3. Figure (d) shows the results of a robustness analysis for the LEO.NB.OCA and LEO.NB.CPA scores for the edge orientation E4 → Trait. The LEO.NB.OCA scores exceed the recommended threshold of 0.3 (red horizontal line), i.e. they retrieve the orientation correctly. Similarly, the LEO.NB.CPA scores exceed the threshold of 0.8.

Similar articles

Cited by

References

    1. Zhou X, Kao M, Wong W. Transitive Functional Annotation By Shortest Path Analysis of Gene Expression Data. PNAS. 2002;99:12783–88. doi: 10.1073/pnas.192159399. - DOI - PMC - PubMed
    1. Steffen M, Petti A, Aach J, D'haeseleer P, Church G. Automated modelling of signal transduction networks. BMC Bioinformatics. 2002;3:34. doi: 10.1186/1471-2105-3-34. - DOI - PMC - PubMed
    1. Stuart JM, Segal E, Koller D, Kim SK. A Gene-Coexpression Network for Global Discovery of Conserved Genetic Modules. Science. 2003;302:249–255. doi: 10.1126/science.1087447. - DOI - PubMed
    1. Zhang B, Horvath S. A General Framework for Weighted Gene Co-Expression Network Analysis. Stat Appl Genet Mol Biol. 2005;4:Article17. doi: 10.2202/1544-6115.1128. - DOI - PubMed
    1. Carlson M, Zhang B, Fang Z, Mischel P, Horvath S, Nelson SF. Gene Connectivity, Function, and Sequence Conservation: Predictions from Modular Yeast Co-expression Networks. BMC Genomics. 2006;7 - PMC - PubMed

Publication types

Substances

LinkOut - more resources