. 2008 Apr;14(4):481-93.
doi: 10.1016/j.devcel.2008.01.018.

Epigenetic blocking of an enhancer region controls irradiation-induced proapoptotic gene expression in Drosophila embryos

Affiliations

Epigenetic blocking of an enhancer region controls irradiation-induced proapoptotic gene expression in Drosophila embryos

Yanping Zhang et al. Dev Cell. 2008 Apr.

Abstract

Drosophila embryos are highly sensitive to gamma-ray-induced apoptosis at early but not later, more differentiated stages during development. Two proapoptotic genes, reaper and hid, are upregulated rapidly following irradiation. However, in post-stage-12 embryos, in which most cells have begun differentiation, neither proapoptotic gene can be induced by high doses of irradiation. Our study indicates that the sensitive-to-resistant transition is due to epigenetic blocking of the irradiation-responsive enhancer region (IRER), which is located upstream of reaper but is also required for the induction of hid in response to irradiation. This IRER, but not the transcribed regions of reaper/hid, becomes enriched for trimethylated H3K27/H3K9 and forms a heterochromatin-like structure during the sensitive-to-resistant transition. The functions of histone-modifying enzymes Hdac1(rpd3) and Su(var)3-9 and PcG proteins Su(z)12 and Polycomb are required for this process. Thus, direct epigenetic regulation of two proapoptotic genes controls cellular sensitivity to cytotoxic stimuli.


Figures

Figure 1
Figure 1. Stage-Specific Sensitivity to γ-ray-Induced Cell Death
(A) Embryonic lethality induced by γ-rays is dependent on developmental stage. Embryos collected 0–3 hr AEL (developmental stages 0–6), 4–7 hr AEL (stages 9–11), 9–12 hr AEL (stage 13–16), and 14–17 hr AEL (stages 16–17) were irradiated with various dosages of γ-irradiation. Each data point represents the average of two to three treatments. Each time an average of 595 eggs were treated. To count for unfertilized eggs, controls were processed in parallel without γ-ray treatment. Embryos that failed to hatch after a 30 hr incubation at 25°C were counted as lethal. (B–E) TUNEL labeling of embryos at 75 min after 40 Gy of γ-irradiation (C and E) or control treatment (B and D). (B) and (C) are stage 10–11 embryos, (D) and (E) are stage 16–17 embryos. Note that irradiation induced widespread cell death in stage 10–11 embryos (compare [C] with [B]) but not in stage 16 embryos (compare [E] with [D]). (F) Venn diagram depicting the overlap of detectable genes in sensitive- and resistant-stage embryos using the pan-genome DNA array. (G) Venn diagram indicating no overlap between γ-ray-inducible genes detected in sensitive (4–7 hr AEL) and resistant (9–12 hr AEL) embryos. The identity of the 11 genes significantly induced by γ-ray irradiation in sensitive embryos is shown at the right side of the figure. (H) Northern hybridization analysis confirms the γ-ray responsiveness of the three cell death genes: reaper, hid, and corp (companion of reaper), and β-actin was used as a nonresponsive control. (I) hid (red square), reaper (green triangle), sickle (yellow diamond), and grim (blue cross) RNA levels (measured by QPCR) in sensitive (continuous lines) and resistant (dashed line) embryos at 20, 40, 60, 90, and 120 min following γ-ray treatment. Data are represented as the fold changes comparing γ-ray-treated with parallel processed control samples (mean ± SD).
Figure 2
Figure 2. Rapid Transition of reaper Sensitivity to Irradiation between 8 and 9 hr AEL
Pooled embryos (0–17 hr AEL) were treated with γ-rays or served as nontreatment control. A significant increase of reaper mRNA was observed in stage 7–11 embryos (A–F), with the peak of responsiveness observed in stage 10 embryos (E versus B). This responsiveness is dramatically decreased once the germ band starts to retract, which happens around 7.5 hr AEL ([J] versus [G]). By the time the germ band is half way retracted on the dorsal side, the responsivenessof reaper is almost completely diminished ([K] versus [H]). None of the embryos at the end of stage 12 (8.5–9 hr AEL) or stage 13 has detectable reaper responsiveness ([L] versus [I]). A very similar transition is also observed for hid responsiveness (Figure S1). The sensitive-to-resistant transition was also verified with QPCR (M). The error bars represent standard deviation.
Figure 3
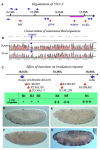
Figure 3. Mapping of the Irradiation-Responsive Region
(A) Organization of the 75C1-2 region that harbors four IAP antagonist genes (red arrows). Other annotated genes in this region were marked with blue arrows. The region underlined by the red line is represented in (B). (B) Conservation of the intergenic region around the reaper locus. The figure was drawn with Vista (Mayor et al., 2000), the curve indicating the percent of identity (window size 100 bp). The region is colored if the identity is higher than 75%. Color code: pink, untranscribed or intronic region; light blue, untranslated transcribed region; dark blue, coding region. (C) The Exelixis insertions localized between reaper and sickle, R1(P{XP}d11052), R2(P{XP}d00909), R3(PBac{WH}f02826), R4(PBac{WH}f03056), R5(PBac{WH}f07603), and R6(PBac{WH}f03389). Induction of reaper by γ-ray irradiation was totally blocked by R1, R2, or R3 but is only slightly attenuated by R4 and R5 and is not at all affected by R6. +++, WT responsiveness; –, no response. For insertion site information, refer to Table S3. (D and E) reaper ISH of control and irradiated homozygous R3 embryos, respectively. (F and G) reaper ISH of control and irradiated homozygous R6 embryos, respectively.
Figure 4
Figure 4. The IRER Is Required for the Responsiveness of reaper and hid
Df(IRER_left) abolished the responsiveness of reaper to irradiation (B and F). hid responsiveness to γ-ray irradiation was also significantly reduced (J and N). Df(IRER_right) reduced reaper responsiveness ([C] and [G] versus [A] and [E]) but blocked hid responsiveness ([K] and [O] versus [I] and [M]). Df(IRER) blocked the responsiveness of both reaper and hid (D, H, L, and P). In (P), the dark embryo is a heterozygous (Df(IRER)/TM3ubi-GFP) embryo that is also stained for GFP.
Figure 5
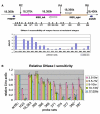
Figure 5. Formation of Closed Heterochromatin Structure in the IRER
(A) DNase I sensitivity assay of the IRER in resistant-stage embryos. In resistant embryo, most of the IRER is as resistant to DNase I as the pericentromeric heterochromatin locus H23. The only exception is a relatively open island around 18,387, flanked by two putative noncoding RNAs (open arrows). (B) Change of DNase I sensitivity in the IRER in staged embryos. There is a dramatic transition of DNase I sensitivity around 18,368–382 between 7 and 9 hr AEL. Data were represented as relative ΔCt, which is ΔCt (target region)/ΔCt (act5c). The ΔCt (act5c) values for different stages are: 6.420 ± 0.424 (3.5–5 hr), 7.278 ± 0.797 (5.5–7 hr), 5.043 ± 0.34 (9–10 hr), 4.460 ± 0.339 (10–13 hr), 4.988 ± 0.256 (17–20 hr). Data are represented as mean ± SD; n = 3 or 4 for all age groups.
Figure 6
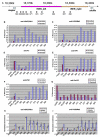
Figure 6. Chromatin Modification of the IRER
(A) Schematic representation of the IRER locus, including IRER_left (red bar) and IRER_right (orange). The positions of DNA amplicons for quantification of ChIP results are shown below the IRER map relative to the DNA sequence coordinates of chromosome 3L (Dm genome release 4.3). (B–G) ChIP assays performed on embryos at sensitive stage (red) and resistant stage (blue) using anti-H3K27Me3 (B), anti-H3K9Me3 (C), anti-Pc (D), anti-HP1 (E), anti-Psc (F), and anti-Ac-H3 (G). Precipitation of DNA fragments with antibodies was quantified by QPCR and shown in recovery rates. The coding region of Act5C was used as a background control for all the antibodies. For positive controls, Ubx promoter region was chosen for anti-H3K27Me3; H23 for anti-H3K9Me3, anti-HP1, and anti-Ac-H3; and the BXD-PRE for anti-Pc and anti-Psc. Several independent assays were performed for each antibody and a representative figure was shown. (H and I) Timing of H3K27 and H3K9 trimethylation, respectively. ChIP results from embryos at sensitive stage (3–7 hr AEL, red), middle stage (7–9 hr AEL, yellow) and resistant stage (13–16 hr AEL, blue) were normalized to the recovery rate of the positive controls in the resistant stage. Three independent assays were performed for each stage, and the values are shown as mean ± SD.
Figure 7
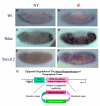
Figure 7. Hdac and Su(z)12 Functions Are Required for the Sensitive-to-Resistant Transition
Responsiveness of reaper (and hid) following irradiation was measured with ISH in stage 13 embryos. In wild-type embryos, there is no response at all (A and B). However, embryos mutated for Hdac (C and D), Su(z)12 (E and F), or Su(v)3-9, Pc, etc. (Table S4) remained responsive till stages 13–14. (G) The schematic diagram summarizes our findings. Epigenetic regulation of the sensitizing enhancer region (IRER) determines whether the proapoptotic gene(s) can be induced by cellular stresses such as DNA damage, and thus controls the sensitivity to stress-induced cell death. Such an epigenetic modification may be reversible and regulated by developmental cues.

Similar articles

Cited by

References

    1. Ashburner M. A Laboratory Handbook. Cold Spring Harbor Laboratory; Cold Spring Harbor, NY: 1989. Drosophila.
    1. Baylin SB, Ohm JE. Epigenetic gene silencing in cancer– a mechanism for early oncogenic pathway addiction? Nat. Rev. Cancer. 2006;6:107–116. - PubMed
    1. Birch-Machin I, Gao S, Huen D, McGirr R, White RA, Russell S. Genomic analysis of heat-shock factor targets in Drosophila. Genome Biol. 2005;6:R63. - PMC - PubMed
    1. Brodsky MH, Nordstrom W, Tsang G, Kwan E, Rubin GM, Abrams JM. Drosophila p53 binds a damage response element at the reaper locus. Cell. 2000;101:103–113. - PubMed
    1. Brodsky MH, Weinert BT, Tsang G, Rong YS, McGinnis NM, Golic KG, Rio DC, Rubin GM. Drosophila melanogaster MNK/Chk2 and p53 regulate multiple DNA repair and apoptotic pathways following DNA damage. Mol. Cell. Biol. 2004;24:1219–1231. - PMC - PubMed

Publication types

MeSH terms