

Active mechanisms are needed to describe cell responses to submicrosecond, megavolt-per-meter pulses: cell models for ultrashort pulses
- PMID: 18408042
- PMCID: PMC2483769
- DOI: 10.1529/biophysj.107.121921
Active mechanisms are needed to describe cell responses to submicrosecond, megavolt-per-meter pulses: cell models for ultrashort pulses
Abstract
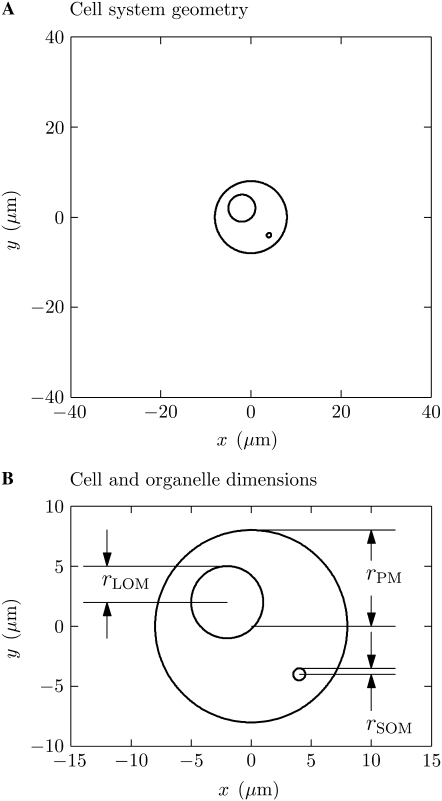
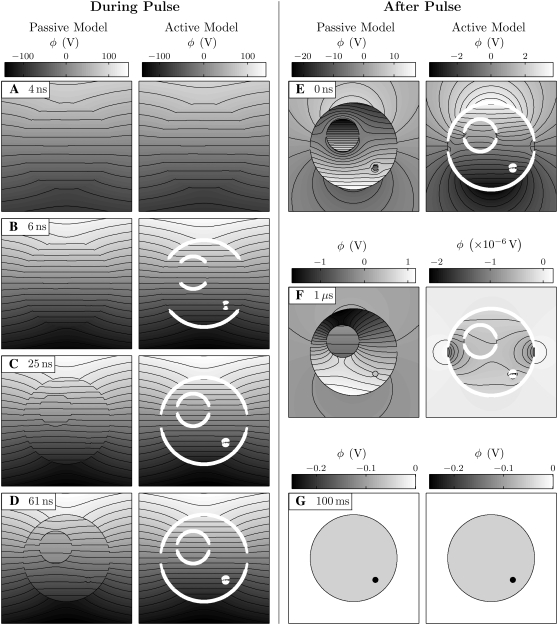
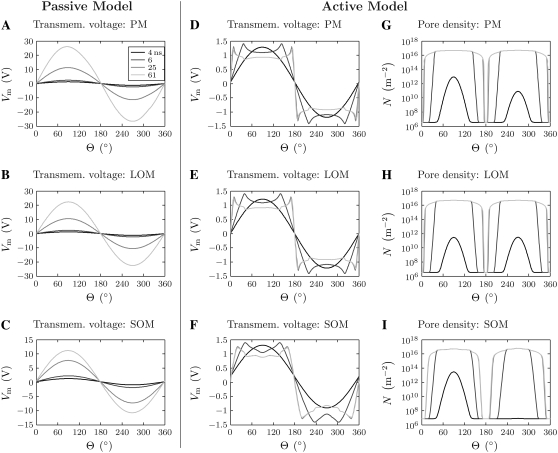
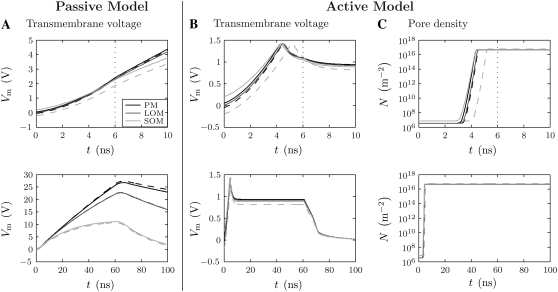
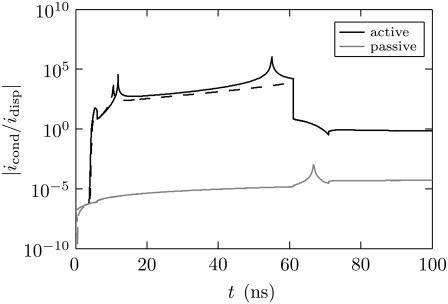
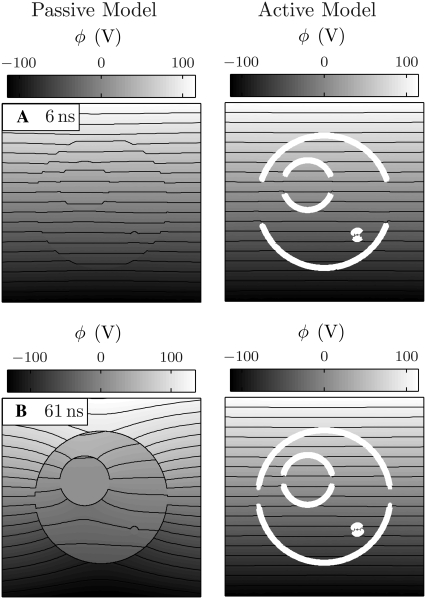
Intracellular effects of submicrosecond, megavolt-per-meter pulses imply changes in a cell's plasma membrane (PM) and organelle membranes. The maximum reported PM transmembrane voltage is only 1.6 V and phosphatidylserine is translocated to the outer membrane leaflet of the PM. Passive membrane models involve only displacement currents and predict excessive PM voltages (approximately 25 V). Here we use a cell system model with nonconcentric circular PM and organelle membranes to demonstrate fundamental differences between active (nonlinear) and passive (linear) models. We assign active or passive interactions to local membrane regions. The resulting cell system model involves a large number of interconnected local models that individually represent the 1), passive conductive and dielectric properties of aqueous electrolytes and membranes; 2), resting potential source; and 3), asymptotic membrane electroporation model. Systems with passive interactions cannot account for key experimental observations. Our active models exhibit supra-electroporation of the PM and organelle membranes, some key features of the transmembrane voltage, high densities of small pores in the PM and organelle membranes, and a global postpulse perturbation in which cell membranes are depolarized on the timescale of pore lifetimes.
Figures

Similar articles
-
Microdosimetry for conventional and supra-electroporation in cells with organelles.Biochem Biophys Res Commun. 2006 Mar 24;341(4):1266-76. doi: 10.1016/j.bbrc.2006.01.094. Epub 2006 Jan 31. Biochem Biophys Res Commun. 2006. PMID: 16469297
-
Modeling environment for numerical simulation of applied electric fields on biological cells.Electromagn Biol Med. 2007;26(3):239-50. doi: 10.1080/15368370701572712. Electromagn Biol Med. 2007. PMID: 17886010
-
Modeling electroporation in a single cell.Biophys J. 2007 Jan 15;92(2):404-17. doi: 10.1529/biophysj.106.094235. Epub 2006 Oct 20. Biophys J. 2007. PMID: 17056739 Free PMC article.
-
Bioelectric effects of intense ultrashort pulses.Crit Rev Biomed Eng. 2010;38(3):255-304. doi: 10.1615/critrevbiomedeng.v38.i3.20. Crit Rev Biomed Eng. 2010. PMID: 21133836 Review.
-
Membrane Electroporation and Electropermeabilization: Mechanisms and Models.Annu Rev Biophys. 2019 May 6;48:63-91. doi: 10.1146/annurev-biophys-052118-115451. Epub 2019 Feb 20. Annu Rev Biophys. 2019. PMID: 30786231 Review.
Cited by
-
Cardiac myocyte excitation by ultrashort high-field pulses.Biophys J. 2009 Feb 18;96(4):1640-8. doi: 10.1016/j.bpj.2008.11.011. Biophys J. 2009. PMID: 19217879 Free PMC article.
-
The Influence of Vesicle Shape and Medium Conductivity on Possible Electrofusion under a Pulsed Electric Field.PLoS One. 2016 Jul 8;11(7):e0158739. doi: 10.1371/journal.pone.0158739. eCollection 2016. PLoS One. 2016. PMID: 27391692 Free PMC article.
-
Effects of electrically-induced constant tension on giant unilamellar vesicles using irreversible electroporation.Eur Biophys J. 2019 Dec;48(8):731-741. doi: 10.1007/s00249-019-01398-9. Epub 2019 Sep 24. Eur Biophys J. 2019. PMID: 31552440
-
Transmembrane potential measurements on plant cells using the voltage-sensitive dye ANNINE-6.Protoplasma. 2010 Nov;247(1-2):3-12. doi: 10.1007/s00709-010-0131-y. Epub 2010 Mar 23. Protoplasma. 2010. PMID: 20309592
-
Optimized nanosecond pulsed electric field therapy can cause murine malignant melanomas to self-destruct with a single treatment.Int J Cancer. 2010 Oct 1;127(7):1727-36. doi: 10.1002/ijc.25364. Int J Cancer. 2010. PMID: 20473857 Free PMC article.
References
-
- Smith, K. C. 2006. Cell and Tissue Electroporation. Master's thesis, Massachusetts Institute of Technology, Cambridge, Massachusetts.
-
- Abidor, I. G., V. B. Arakelyan, L. V. Chernomordik, Y. A. Chizmadzhev, V. F. Pastushenko, and M. R. Tarasevich. 1979. Electric breakdown of bilayer membranes. I. The main experimental facts and their qualitative discussion. Bioelectrochem. Bioenerg. 6:37–52.
-
- Weaver, J. C., and Y. A. Chizmadzhev. 1996. Theory of electroporation: a review. Bioelectrochem. Bioenerg. 41:135–160.
-
- Weaver, J. C. 2003. Electroporation of biological membranes from multicellular to nano scales. IEEE Trans. Dielect. Elect. Ins. 10:754–768.
-
- Teissie, J., M. Golzio, and M. P. Rols. 2005. Mechanisms of cell membrane electropermeabilization: a minireview of our present (lack of?) knowledge. BBA Gen. Subjects. 1724:270–280. - PubMed
Publication types
MeSH terms
Grants and funding
LinkOut - more resources
Full Text Sources
Other Literature Sources
