. 2008 Dec;18(12):2855-67.
doi: 10.1093/cercor/bhn044. Epub 2008 Apr 9.

Hearing loss alters the subcellular distribution of presynaptic GAD and postsynaptic GABAA receptors in the auditory cortex

Affiliations

Hearing loss alters the subcellular distribution of presynaptic GAD and postsynaptic GABAA receptors in the auditory cortex

Emma C Sarro et al. Cereb Cortex. 2008 Dec.

Abstract

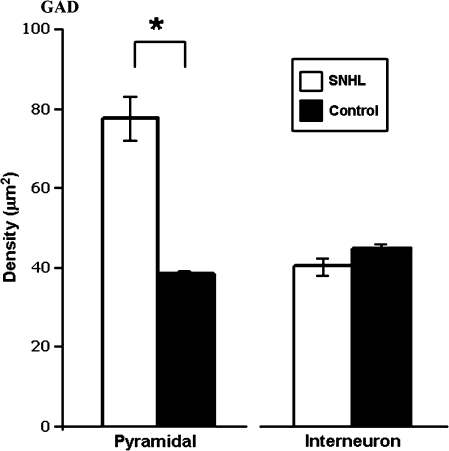
We have shown previously that auditory experience regulates the maturation of excitatory synapses in the auditory cortex (ACx). In this study, we used electron microscopic immunocytochemistry to determine whether the heightened excitability of the ACx following neonatal sensorineural hearing loss (SNHL) also involves pre- or postsynaptic alterations of GABAergic synapses. SNHL was induced in gerbils just prior to the onset of hearing (postnatal day 10). At P17, the gamma-aminobutyri acid type A (GABA(A)) receptor's beta2/3-subunit (GABA(A)beta2/3) clusters residing at plasma membranes in layers 2/3 of ACx was reduced significantly in size (P < 0.05) and number (P < 0.005), whereas the overall number of immunoreactive puncta (intracellular + plasmalemmal) remained unchanged. The reduction of GABA(A)beta2/3 was observed along perikaryal plasma membranes of excitatory neurons but not of GABAergic interneurons. This cell-specific change can contribute to the enhanced excitability of SNHL ACx. Presynaptically, GABAergic axon terminals were significantly larger but less numerous and contained 47% greater density of glutamic acid decarboxylase immunoreactivity (P < 0.05). This suggests that GABA synthesis may be upregulated by a retrograde signal arising from lowered levels of postsynaptic GABA(A)R. Thus, both, the pre- and postsynaptic sides of inhibitory synapses that form upon pyramidal neurons of the ACx are regulated by neonatal auditory experience.


Figures

Figure 1.
Figure 1.
Light microscopic localization of GABAAβ2/3 subunits and GAD in the ACx. (A and B) The antibody directed against the GABAAβ2/3 subunits recognizes puncta (arrowheads) surrounding unlabeled cell bodies in layers 2/3 of Control ACx (asterisks in the nucleoplasm, A). The same antibody labels the perikaryal cytoplasm of a few neurons in an age-matched, SNHL ACx (asterisks in the nucleoplasm, B). Some of the puncta appear strung together (triple arrowheads in A and B). bv = blood vessel lumen. (C and D) The antibody directed against GAD65/67 recognizes puncta that surround unlabeled perikarya (black asterisks) of control (C) and SNHL (D) animals. In addition, some of the neuronal perikarya are intensely immunoreactive (white asterisks). Calibration bar = 50 μm for all panels.
Figure 2.
Figure 2.
Electron micrographs showing examples of GABAAβ2/3 immunolabeling on the plasma membrane and at intracellular sites within layers 2/3 of ACx. GABAAβ2/3 immunolabeling is revealed by the DAB procedure in figures (A) to (D) and by the SIG procedure in figures (E) to (H). (A) Plasmalemmal labeling (arrowhead) at a perikaryon of a control animal's ACx. Immunoreactivity is at the symmetric synapse (arrowhead) and extends intracellularly (arrow) toward the endoplasmic reticulum. Such continuous labeling was tallied as labeled under both “intracellular” and “plasmalemmal” categories. Thick short arrows show lack of immunoreactivity at postsynaptic densities of asymmetric synapses. Here and in other panels, At = axon terminal. (B) Another example of plasmalemmal labeling, captured at a higher magnification. At this symmetric synapse (arrowhead), DAB labeling extends intracellularly (arrow). The same dendrite is juxtaposed to another axon (upper right), so identified by the presence of vesicles elsewhere. The dendritic plasma membrane facing this axon exhibits much less DAB labeling. (C) Patches of intracellular labeling (arrow) within a dendrite of an SNHL animal's ACx. The patches are near a clearly unlabeled symmetric (presumably inhibitory) synapse. This is further established by the presence of a dense-cored vesicle within the axon terminal (white arrow). Arrowheads point to plasmalemmal immunolabeling that are nonsynaptic. (D) A lack of DAB immunoreactivity in control sections incubated without the primary antibody at the site of a symmetric synapse and within the postsynaptic dendrite. (E) Cluster of SIG particles (white asterisk here and in F and G) at the junction between 2 plasma membranes forming a symmetric synapse onto a soma (S). A nearby asymmetric (presumably excitatory) synapse (arrow) is unlabeled. Note the tissue: Embed812 interface, marked by black crosses (+). Proximity of the sampled tissue to the tissue–Embed812 interface was intentional, to assure sampling from a region that was exposed maximally to immunoreagents. (F) Similar clustering of SIG particles at a symmetric synapse formed upon a dendrite (D). (G) SIG particles are found within the intracellular portion of a soma (S), near a symmetric synapse formed by the axon terminal, At. (H) Lack of SIG immunoreactivity at a symmetric synapse onto a distal dendrite as well within the intracellular portion of the dendrite in control tissue incubated without the primary antibody. (I) Quantitative analysis of GABAAβ2/3–DAB immunoreactivity encountered across the ACx from 3 controls and 3 SNHL animals. Cortices of control animals show a significantly higher proportion of total GABAAβ2/3 immunolabeling on plasma membranes (white bars). In contrast, cortices of SNHL animals show a significantly higher proportion of GABAAβ2/3 immunolabeling intracellularly (black bars), away from the plasma membranes. (J) Quantitative analysis of the SIG particle cluster distribution pattern. Cortices of control animals show a significantly higher proportion of total GABAAβ2/3 immunolabeling by SIG on plasma membranes (white bars), whereas cortices of SNHL animals show a significantly higher proportion of GABAAβ2/3 immunolabeling intracellularly (black bars), away from plasma membranes. Asterisks in (I) and (J) mark significance of P < 0.002, determined by 2-tailed Student's t-test. At, axon terminal; S, soma; D, dendrite. Scale bars = 500 nm.
Figure 2.
Figure 2.
Electron micrographs showing examples of GABAAβ2/3 immunolabeling on the plasma membrane and at intracellular sites within layers 2/3 of ACx. GABAAβ2/3 immunolabeling is revealed by the DAB procedure in figures (A) to (D) and by the SIG procedure in figures (E) to (H). (A) Plasmalemmal labeling (arrowhead) at a perikaryon of a control animal's ACx. Immunoreactivity is at the symmetric synapse (arrowhead) and extends intracellularly (arrow) toward the endoplasmic reticulum. Such continuous labeling was tallied as labeled under both “intracellular” and “plasmalemmal” categories. Thick short arrows show lack of immunoreactivity at postsynaptic densities of asymmetric synapses. Here and in other panels, At = axon terminal. (B) Another example of plasmalemmal labeling, captured at a higher magnification. At this symmetric synapse (arrowhead), DAB labeling extends intracellularly (arrow). The same dendrite is juxtaposed to another axon (upper right), so identified by the presence of vesicles elsewhere. The dendritic plasma membrane facing this axon exhibits much less DAB labeling. (C) Patches of intracellular labeling (arrow) within a dendrite of an SNHL animal's ACx. The patches are near a clearly unlabeled symmetric (presumably inhibitory) synapse. This is further established by the presence of a dense-cored vesicle within the axon terminal (white arrow). Arrowheads point to plasmalemmal immunolabeling that are nonsynaptic. (D) A lack of DAB immunoreactivity in control sections incubated without the primary antibody at the site of a symmetric synapse and within the postsynaptic dendrite. (E) Cluster of SIG particles (white asterisk here and in F and G) at the junction between 2 plasma membranes forming a symmetric synapse onto a soma (S). A nearby asymmetric (presumably excitatory) synapse (arrow) is unlabeled. Note the tissue: Embed812 interface, marked by black crosses (+). Proximity of the sampled tissue to the tissue–Embed812 interface was intentional, to assure sampling from a region that was exposed maximally to immunoreagents. (F) Similar clustering of SIG particles at a symmetric synapse formed upon a dendrite (D). (G) SIG particles are found within the intracellular portion of a soma (S), near a symmetric synapse formed by the axon terminal, At. (H) Lack of SIG immunoreactivity at a symmetric synapse onto a distal dendrite as well within the intracellular portion of the dendrite in control tissue incubated without the primary antibody. (I) Quantitative analysis of GABAAβ2/3–DAB immunoreactivity encountered across the ACx from 3 controls and 3 SNHL animals. Cortices of control animals show a significantly higher proportion of total GABAAβ2/3 immunolabeling on plasma membranes (white bars). In contrast, cortices of SNHL animals show a significantly higher proportion of GABAAβ2/3 immunolabeling intracellularly (black bars), away from the plasma membranes. (J) Quantitative analysis of the SIG particle cluster distribution pattern. Cortices of control animals show a significantly higher proportion of total GABAAβ2/3 immunolabeling by SIG on plasma membranes (white bars), whereas cortices of SNHL animals show a significantly higher proportion of GABAAβ2/3 immunolabeling intracellularly (black bars), away from plasma membranes. Asterisks in (I) and (J) mark significance of P < 0.002, determined by 2-tailed Student's t-test. At, axon terminal; S, soma; D, dendrite. Scale bars = 500 nm.
Figure 3.
Figure 3.
Electron micrographs show highly specific GAD65/67 immunolabeling of inhibitory axon terminals. (A, B) SIG immunolabeling (white asterisks) within inhibitory axon profiles forming symmetric (presumably inhibitory) synapses onto adjacent somata (S). White arrows denote active zones of the synapses. The density of SIG particles within the axon profiles is visibly lower in the tissue of the control (A) than of the SNHL (B) animal. (C) An axon terminal (white star) forming a symmetric synapse is intensely labeled with DAB. In contrast, the axon terminals forming asymmetric synapses (presumably excitatory, black arrows point to presynaptic membranes) are clearly unlabeled. Scale bars: 500 nm.
Figure 4.
Figure 4.
(A) The mean density of GAD within GABAergic inhibitory axon terminals. This value is significantly higher in cortices of SNHL animals than of controls. The values represent the group means for the density of GAD65/67–SIG particle counts within presynaptic terminals. The asterisk represents P < 0.005, determined by Kolmogorov–Smirnov test of independent groups. (B) Histogram compares the distribution of GAD density within axon profiles between both groups. There are proportionally more axon profiles which show higher GAD density levels (in SNHL animals>150 SIG particles/μm2) than in control animals.
Figure 5.
Figure 5.
Comparison of the GABAAβ2/3 and GAD SIG cluster sizes across sensory rearing conditions. The upper graph shows the size distribution of the area of GABAAβ2/3 SIG clusters occurring along the postsynaptic plasma membrane of dendrites within ACx of Control and SNHL animals. The lower graph shows the size distribution of the area of GAD SIG clusters occurring within axon terminals of Control and SNHL animals Each SIG cluster was measured using Adobe Photoshop (version 6.0) and converted from pixels to the unit of nm2. Arrows point to the mean values for each sensory rearing condition.
Figure 6.
Figure 6.
Somatic distribution of GABAA β2/3, as revealed by SIG labels. Somata of pyramidal neurons targeted by inhibitory axon terminals in cortices of SNHL animals show a significantly higher proportion of total β2/3 immunolabeling intracellularly (black bars) than in the ACx of control animals. Conversely, the ACx of controls have a significantly higher proportion of total GABAAβ2/3 immunolabeling on plasma membranes of pyramidal neurons (white bars). In contrast, the distribution of the GABAAβ2/3 immunolabeling within somata of interneurons do not show any significant difference between sensory rearing conditions. Asterisk marks significance (P < 0.05), determined by 2-tailed Student's t-test.
Figure 7.
Figure 7.
Density of GAD–SIG within axons targeting somata. The mean density of GAD particles within GABAergic axon terminals targeting somata of pyramidal neurons in the ACx of SNHL animals is significantly higher than the GAD levels targeting somata of pyramidal neurons in the control ACx. However, the mean density of GAD within GABAergic axon terminals targeting somata of interneurons is not significantly different between the 2 sensory rearing conditions. Asterisk marks significance of P < 0.05.

Similar articles

Cited by

References

    1. Abbott SD, Hughes LF, Bauer CA, Salvi R, Caspary DM. Detection of Glutamate Decarboxylase isoforms in rat inferior colliculus following acoustic exposure. Neuroscience. 1999;93:1375–1381. - PubMed
    1. Amin J, Weiss DS. GABAA receptor needs two homologous domains of the beta-subunit for activation by GABA but not by pentobarbital. Nature. 1993;366:565–569. - PubMed
    1. Aoki C, Mahodomrongkul V, Fujisawa S, Habersat R, Shirao T. Chemical and morphological alterations of spines within the hippocampus and entorhinal cortex precedes the onset of Alzheimer's disease pathology in double knock-in mice. J Comp Neurol. 2007;505:352–462. - PMC - PubMed
    1. Aoki C, Rodrigues S, Kurose H. Use of electron microscopy in the detection of adrenergic receptors. Methods Mol Biol. 2000;126:535–63. - PMC - PubMed
    1. Barnes EM., Jr Use-dependent regulation of GABAA receptors. Int Rev Neurobiol. 1996;39:53–76. - PubMed

Publication types

MeSH terms