. 2008 Apr 9;28(15):3947-57.
doi: 10.1523/JNEUROSCI.5667-07.2008.

Altered histone monoubiquitylation mediated by mutant huntingtin induces transcriptional dysregulation

Affiliations

Altered histone monoubiquitylation mediated by mutant huntingtin induces transcriptional dysregulation

Mee-Ohk Kim et al. J Neurosci. .

Abstract

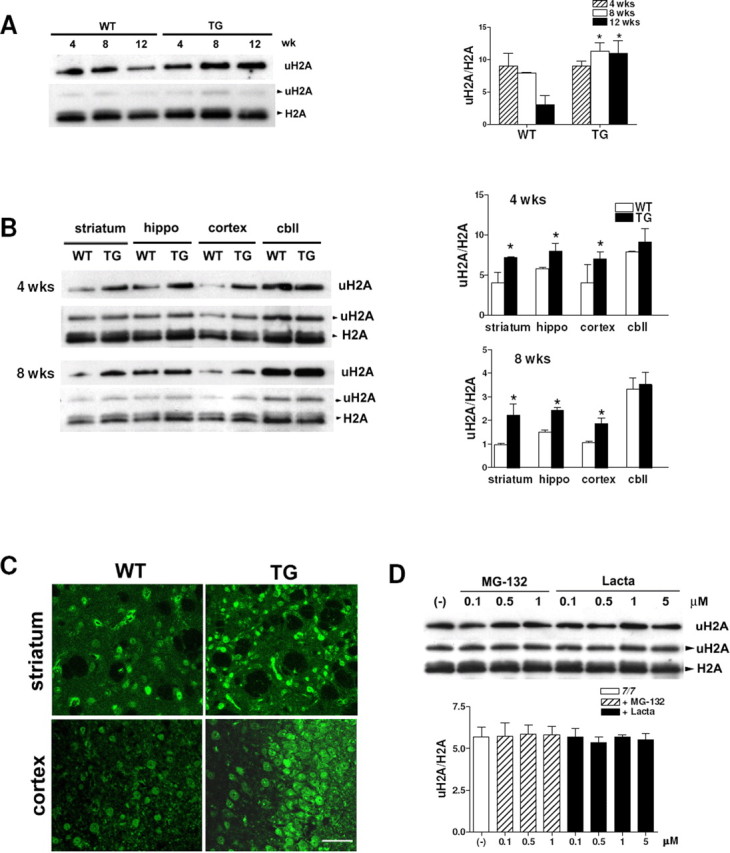
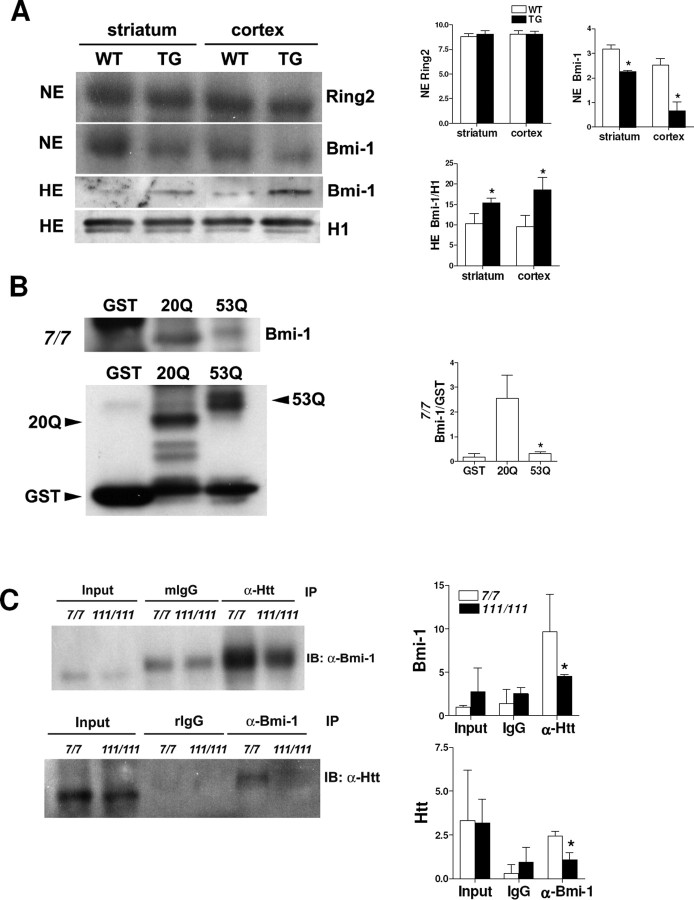
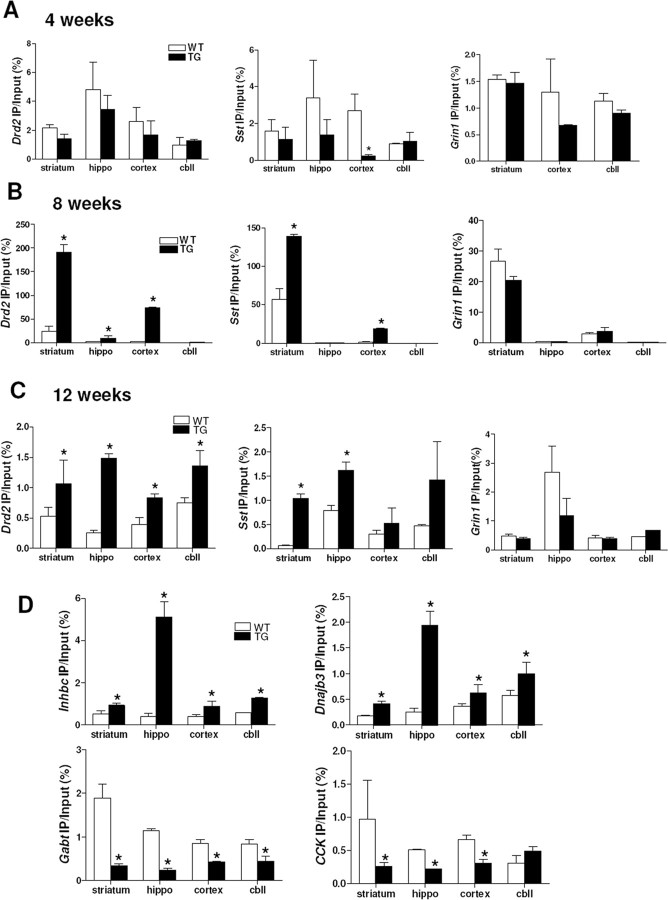
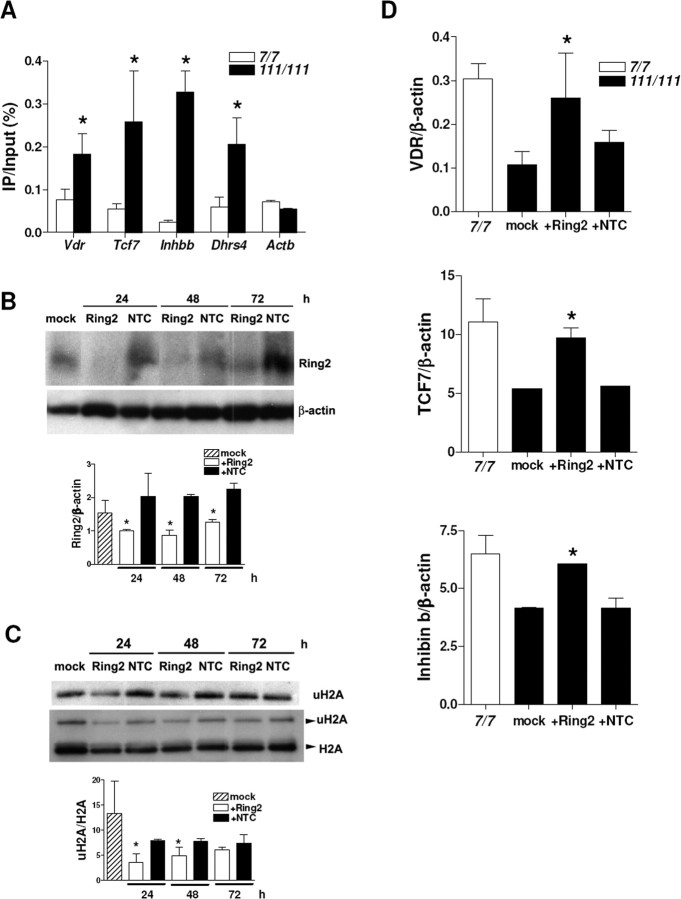
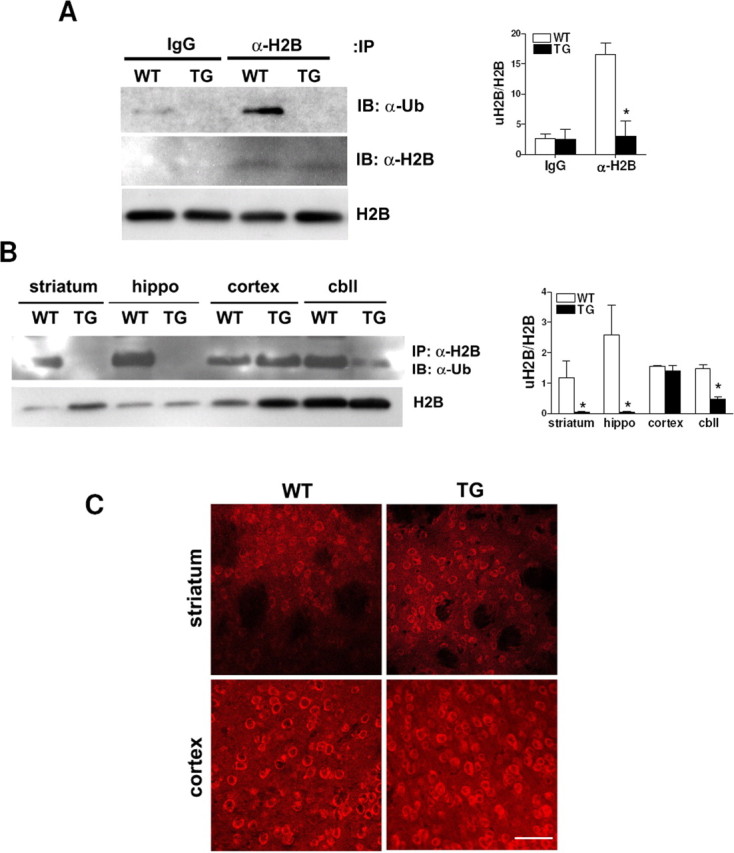
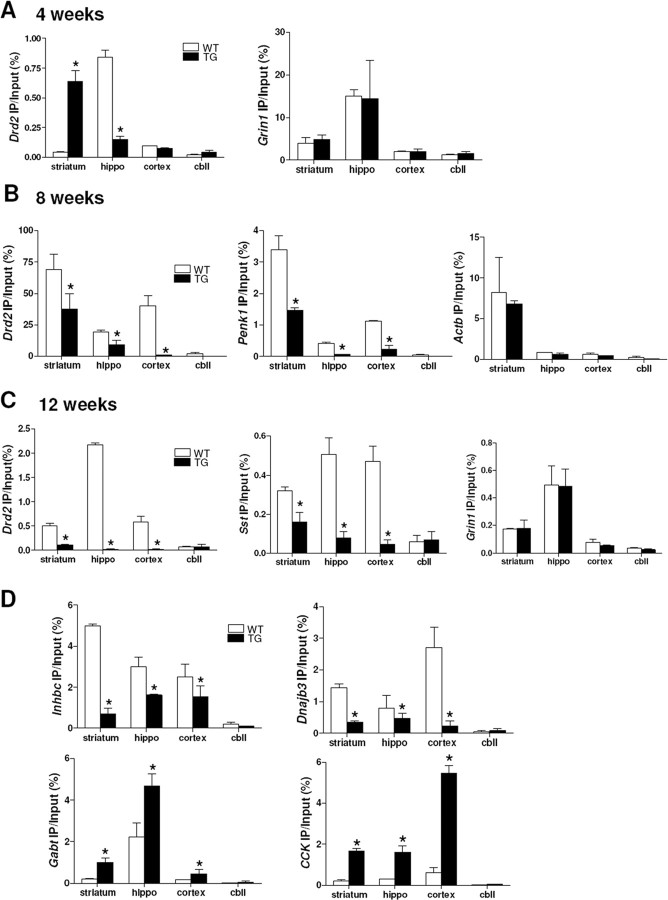
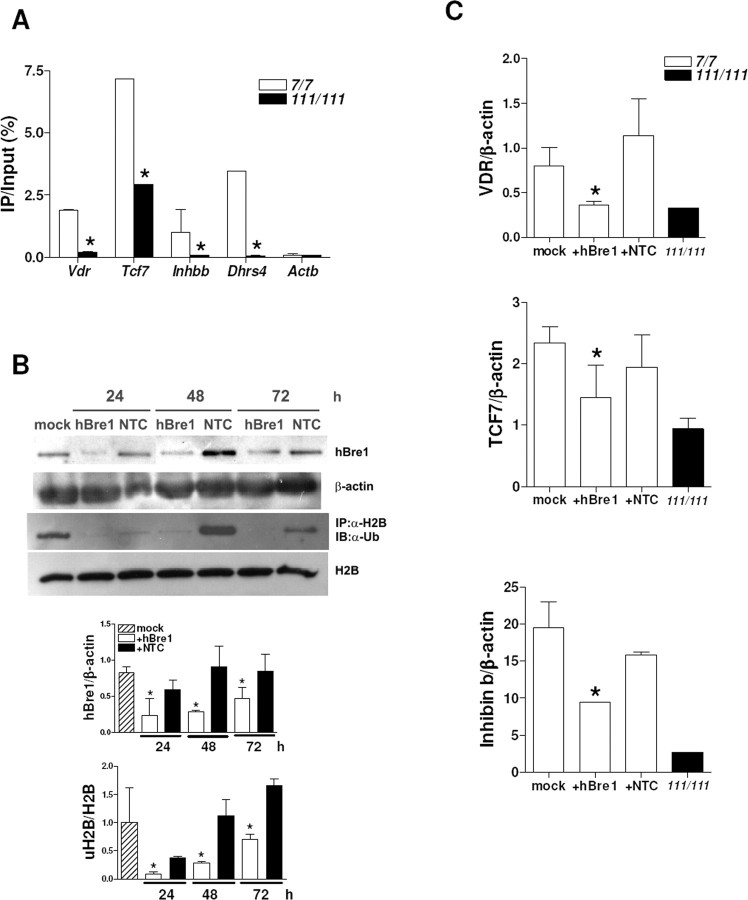
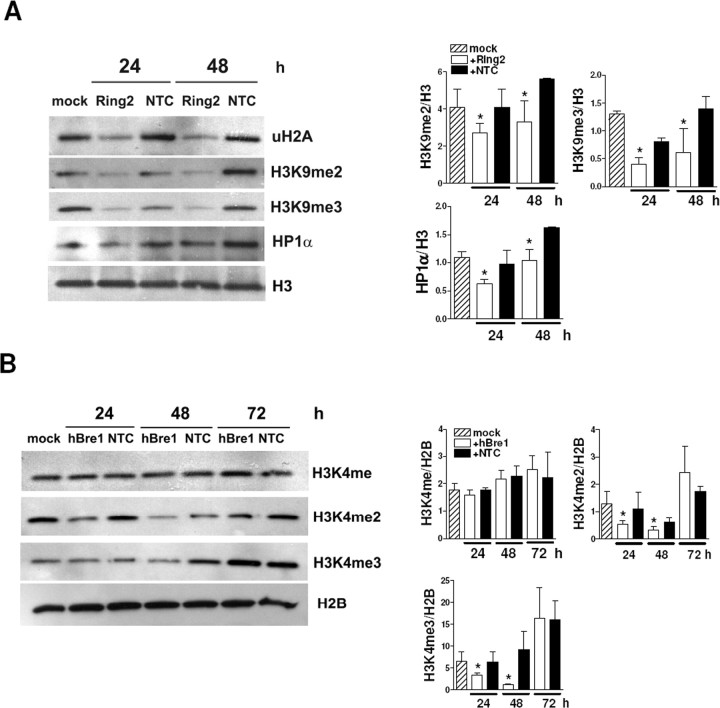
Although transcriptional dysregulation is a critical pathogenic mechanism in Huntington's disease (HD), it is still not known how mutant huntingtin causes it. Here we show that alteration of histone monoubiquitylation is a key mechanism. Disrupted interaction of huntingtin with Bmi-1, a component of the hPRC1L E3 ubiquitin ligase complex, increases monoubiquityl histone H2A (uH2A) levels in a cell culture model of HD. Genes with expression that is repressed in transgenic R6/2 mouse brain have increased uH2A and decreased uH2B at their promoters, whereas actively transcribed genes show the opposite pattern. Reduction in uH2A reverses transcriptional repression and inhibits methylation of histone H3 at lysine 9 in cell culture. In contrast, reduction in uH2B induces transcriptional repression and inhibits methylation of histone H3 at lysine 4. This is the first report to demonstrate hPRC1L as a huntingtin-interacting histone modifying complex and a crucial role for histone monoubiquitylation in mammalian brain gene expression, which broadens our understanding of histone code. These findings also provide a rationale for targeting histone monoubiquitylation for therapy in HD.


Figures

Figure 1.
Figure 1.
Increased uH2A in transgenic R6/2 brain. A, Top, Western blot analyses probed with anti-uH2A antibody showing increased global uH2A levels in transgenic R6/2 whole brains at the age of 8 and 12 weeks compared with wild type. Bottom, This blot was stripped and reprobed with anti-H2A antibody, which recognizes both monoubiquitylated and unmodified H2A, marked as uH2A and H2A, respectively. To quantify uH2A levels, intensities of uH2A bands in the top panel were normalized to those of H2A bands in the bottom panel (uH2A/H2A). Densitometry of uH2A/H2A is shown on the right (n = 4 animals per group; *p < 0.05). B, Western blots showing increased global uH2A levels in 4 and 8 week transgenic R6/2 striatum, hippocampus, and cortex, but not cerebellum. Densitometry of uH2A/H2A is shown on the right (n = 3 animals per group; *p < 0.05). C, Confocal images of 12 week R6/2 brain sections stained with anti-uH2A antibody (scale bar, 50 μm). D, Western blots showing no change in uH2A in STHdh7/7 cells treated with MG-132 (0.1–1 μm) or lactacystin (Lacta; 0.1–5 μm) for 24 h. Densitometry of uH2A/H2A is shown below (n = 4 independent experiments). Error bars indicate SEM. TG, Transgenic; WT, wild type; wk(s), week(s); hippo, hippocampus; cbll, cerebellum.
Figure 2.
Figure 2.
Increased Bmi-1 binding to DNA in the presence of mutant huntingtin. A, Top, Western blot showing no difference in the Ring2 level in nuclear extracts (NE) between 8 week wild-type and transgenic R6/2 striatum and cortex. The blot was stripped and reprobed with anti-Bmi-1 antibody, which showed lower Bmi-1 in nuclear extracts from transgenic striatum and cortex. Densitometry of Ring2 and Bmi-1 is shown on the right (n = 3 animals per group; *p < 0.05). Bottom, Western blot showing higher Bmi-1 levels in histone extracts (HE) from 8 week transgenic R6/2 striatum and cortex. The blot was stripped and reprobed with anti-histone H1 antibody for an internal control. Bmi-1 bands were normalized to H1 bands (Bmi-1/H1), and densitometry of Bmi-1/H1 is shown on the right (n = 3 animals per group; *p < 0.05). B, GST pull-down assay showing Bmi-1 in nuclear extracts from STHdh7/7 cells binds to GST–exon 1 wild-type Htt (20Q) but less binds to GST–exon 1 mutant Htt (53Q). One-tenth of nuclear extracts used for the pull-down assay were loaded as the input. Dark bands in the GST lane are nonspecific ones. Immunoblotting of GST alone, 20Q, and 53Q proteins was performed with an anti-GST antibody. Then, Bmi-1 bands were normalized to GST bands (Bmi-1/GST.) Densitometry of Bmi-1/GST is shown on the right (n = 3 independent experiments; *p < 0.05, 20Q vs 53Q). C, Coimmunoprecipitation (IP) with anti-Htt antibody showing wild-type Htt in STHdh7/7 cells binds to Bmi-1, but mutant Htt in STHdh 111/111 does less. Another IP with anti-Bmi-1 antibody shows less Bmi-1 binding to mutant Htt than wild-type Htt. One-fifth of nuclear extracts used for the IPs were loaded as the input. Mouse (mIgG) and rabbit (rIgG) IgG are isotype-matched controls for the anti-Htt and anti-Bmi-1, respectively. Densitometry of Bmi-1 and Htt bands is shown below (n = 3 independent experiments; *p < 0.05). IB, Immunoblot. Error bars indicate SEM.
Figure 3.
Figure 3.
In vivo ChIP demonstrates that uH2A association with gene promoters inversely correlates with transcriptional activity in R6/2. A, No difference in uH2A association with Drd2, Sst, and Grin1 gene promoters between 4 week wild-type and transgenic R6/2 brain regions, except for decreased uH2A association with Sst gene promoter in transgenic cortex (n = 3 animals per group; *p < 0.05). uH2A enrichment in Grin1 gene promoter in hippocampus (hippo) was below a detection limit in both wild-type and transgenic mice. B, Increased uH2A association with Drd2 gene promoter in 8 week transgenic striatum, hippocampus, and cortex but not cerebellum (cbll) compared with wild-type. Increased uH2A association with Sst gene promoter in 8 week transgenic striatum and cortex, but not in hippocampus or cerebellum (n = 3 animals per group; *p < 0.05). C, Increased uH2A association with Drd2 gene promoters in all brain regions of 12 week transgenic R6/2 compared with wild type but increased uH2A association with Sst gene promoter in 12 week R6/2 striatum and hippocampus (n = 3 animals per group; *p < 0.05). D, Increased uH2A association with expressed-WT-only Inhbc and Dnaj3b gene promoters but decreased uH2A association with expressed-Tg-only Gabt and upregulated-Tg CCK gene promoters in all brain regions of 12 week transgenic mice, except for CCK in transgenic cerebellum, compared with wild type (n = 3 animals per group; *p < 0.05). Error bars indicate SEM. TG, Transgenic; WT, wild type; hippo, hippocampus; cbll, cerebellum; IP, immunoprecipitation.
Figure 4.
Figure 4.
Increased uH2A association with genes downregulated in a cell culture model of HD and Ring2 knockdown-mediated reversal of transcriptional repression. A, Increased uH2A association with Vdr, Tcf7, Inhbb, and Dhrs4 gene promoters in STHdh111/111 cells compared with STHdh7/7 cells (n = 3 independent experiments; *p < 0.05). B, Western blot showing a reduced Ring2 protein level in STHdh111/111 cells transfected with 100 nm Ring2 siRNA (Ring2) for 24–72 h. Mock or 100 nm nontargeting control siRNA (NTC)-transfected cells do not show a significant change in Ring2 protein level. For an internal control, the blot was stripped and reprobed for β-actin. Ring2 bands were normalized to β-actin bands (Ring2/β-actin), and densitometry of Ring2/β-actin is shown below (n = 3 independent experiments; *p < 0.05, Ring2 vs NTC). C, Western blot showing reduction in the uH2A level in STHdh111/111 cells transfected with 100 nm Ring2 siRNA for 24–48 h. Densitometry of uH2A/H2A is shown below (n = 4 independent experiments; *p < 0.05, Ring2 vs NTC). D, Quantitative real-time PCR showing increased mRNA levels of VDR, TCF7, and Inhibin b in STHdh111/111 cells transfected with 100 nm Ring2 siRNA for 24 h, which is equivalent to those in STHdh7/7 cells. mRNA levels of each gene normalized to that of β-actin gene are indicated as VDR/β-actin, TCF7/β-actin, and Inhibin b/β-actin. Mock or NTC-transfected cells do not show any changes in mRNA levels of those genes (n = 4 independent experiments; *p < 0.05, Ring2 vs NTC). Error bars indicate SEM. IP, Immunoprecipitation.
Figure 5.
Figure 5.
uH2B is decreased in transgenic R6/2 brain. A, Western blot showing that the global uH2B level in 8 week transgenic R6/2 whole brains was below a detection limit of immunoprecipitation (IP) with IgG or anti-H2B antibody followed by immunoblotting with anti-ubiquitin antibody (IB: α-Ub). This blot was stripped and reprobed with anti-H2B antibody, which showed that the same amounts of H2B were pulled down from wild-type and transgenic mice (IB: α-H2B). Western blot analysis of histone extracts also demonstrated H2B expression levels were equal in wild-type and transgenic mice (H2B). Densitometry of uH2B/H2B is shown on the right (n = 4 animals per group; *p < 0.05). B, Western blot showing global uH2B levels are undetectable in 4 week transgenic striatum and hippocampus and low in 4 week transgenic cerebellum. Western blot analysis of histone extracts from each brain region of 4 week mice demonstrated equal expression levels of H2B in wild-type and transgenic mice (H2B). Densitometry of uH2B/H2B is shown on the right (n = 4 animals per group; *p < 0.05). C, Confocal images of 12 week wild-type and transgenic brains stained with anti-hBre1 serum (scale bar, 50 μm). Error bars indicate SEM. TG, Transgenic; WT, wild type; hippo, hippocampus; cbll, cerebellum.
Figure 6.
Figure 6.
In vivo ChIP demonstrates that uH2B association with gene promoters positively correlates with transcriptional activity in R6/2. A, uH2B association with Drd2 gene promoter was increased in striatum but decreased in hippocampus of 4 week transgenic R6/2. No difference in uH2B association with Actb gene promoter between wild-type and transgenic mice (n = 3 animals per group; *p < 0.05). B, Decreased uH2B association with Drd2 and Penk1 gene promoters in 8 week transgenic striatum, hippocampus, and cortex, but not cerebellum, compared with wild type (n = 3 animals per group; *p < 0.05). C, Decreased uH2B association with Drd2 and Sst gene promoters in 12 week transgenic striatum, hippocampus, and cortex, but not cerebellum, compared with wild type (n = 3 animals per group; *p < 0.05). D, Decreased uH2B association with expressed-WT-only Inhbc and Dnaj3b gene promoters but increased uH2B association with expressed-Tg-only Gabt and upregulated-Tg CCK gene promoters in 8 week transgenic striatum, hippocampus, and cortex, but not cerebellum, compared with wild type (n = 4 animals per group; *p < 0.05). Error bars indicate SEM. TG, Transgenic; WT, wild type; hippo, hippocampus; cbll, cerebellum.
Figure 7.
Figure 7.
Decreased uH2B associations with genes downregulated in a cell culture model of HD and hBre1 knockdown-mediated transcriptional repression. A, Decreased uH2B association with Vdr, Tcf7, Inhbb, and Dhrs4 gene promoters in STHdh111/111 cells compared with that in STHdh7/7 cells (n = 3 independent experiments; *p < 0.05). IP, Immunoprecipitation. B, Western blot showing decreased levels of hBre1 and uH2B in STHdh7/7 cells transfected with 100 nm hBre1siRNA (hBre1) for 24–72 h. Mock or nontargeting control siRNA (NTC)-transfected cells do not affect them. β-Actin and H2B were used as internal controls for hBre1 and uH2B, respectively. Densitometry of hBre1/β-actin and uH2B/H2B is shown below (n = 3 independent experiments; *p < 0.05, hBre1 vs NTC). C, Quantitative real-time PCR showing that decreased mRNA levels of VDR, TCF7, and Inhibin b in STHdh7/7 cells transfected with 100 nm hBre1 siRNA for 48 h, which is equivalent to those in STHdh111/111cells. mRNA levels of each gene normalized to that of β-actin gene are indicated as VDR/β-actin, TCF7/β-actin, and Inhibin b/β-actin (n = 4 independent experiments; *p < 0.05, hBre1 vs NTC). Error bars indicate SEM.
Figure 8.
Figure 8.
uH2A regulates methylation of histone H3 at lysine 9 and recruitment of HP1α, whereas uH2B regulates methylation of histone H3 at lysine 4. A, Western blots showing decreased histone H3 di- and tri-methylation at lysine 9 (H3K9me2 and H3K9me3, respectively) and HP1α in STHdh111/111 cells transfected with Ring2 siRNA for 24–48 h. H3 was used as an internal control. Densitometry of H3K9me2/H3, H3K9me3/H3, and HP1α/H3 is on the right (n = 3 independent experiments; *p < 0.05, Ring2 vs NTC). B, Western blots showing decreased histone H3 di-and tri-methylation at lysine 4 (H3K4me2 and H3K4me3) but no change in monomethyl histone H3 at lysine 4 (H3K4me) in STHdh7/7cells transfected with hBre1 siRNA for 24–72 h. H2B was used as an internal control. Densitometry of H3K4me/H2B, H3K4me2/H2B, and H3K4me3/H2B is shown on the right (n = 3 independent experiments; *p < 0.05, hBre1 vs NTC). Error bars indicate SEM.

Similar articles

Cited by

References

    1. Augood SJ, Faull RL, Emson PC. Dopamine D1 and D2 receptor gene expression in the striatum in Huntington's disease. Ann Neurol. 1997;42:215–221. - PubMed
    1. Bannister AJ, Zegerman P, Partridge JF, Miska EA, Thomas JO, Allshire RC, Kouzarides T. Selective recognition of methylated lysine 9 on histone H3 by the HP1 chromo domain. Nature. 2001;410:120–124. - PubMed
    1. Cao R, Tsukada Y, Zhang Y. Role of Bmi-1 and Ring1A in H2A ubiquitylation and Hox gene silencing. Mol Cell. 2005;20:845–854. - PubMed
    1. Cattaneo E, Conti L. Generation and characterization of embryonic striatal conditionally immortalized ST14A cells. J Neurosci Res. 1998;53:223–234. - PubMed
    1. Cha JH, Kosinski CM, Kerner JA, Alsdorf SA, Mangiarini L, Davies SW, Penney JB, Bates GP, Young AB. Altered brain neurotransmitter receptors in transgenic mice expressing a portion of an abnormal human Huntington disease gene. Proc Natl Acad Sci USA. 1998;95:6480–6485. - PMC - PubMed

Publication types

MeSH terms

LinkOut - more resources