Characterization of the inflammatory response during acute and post-acute phases after severe burn
- PMID: 18391855
- PMCID: PMC7863568
- DOI: 10.1097/SHK.0b013e31816e3373
Characterization of the inflammatory response during acute and post-acute phases after severe burn
Abstract
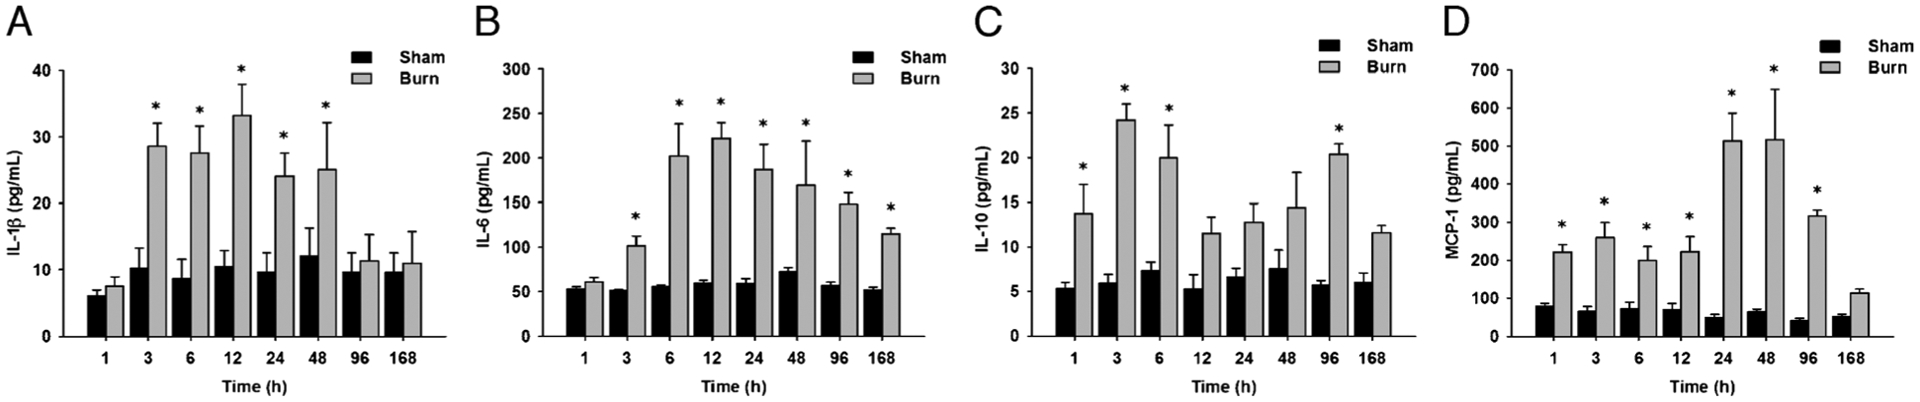
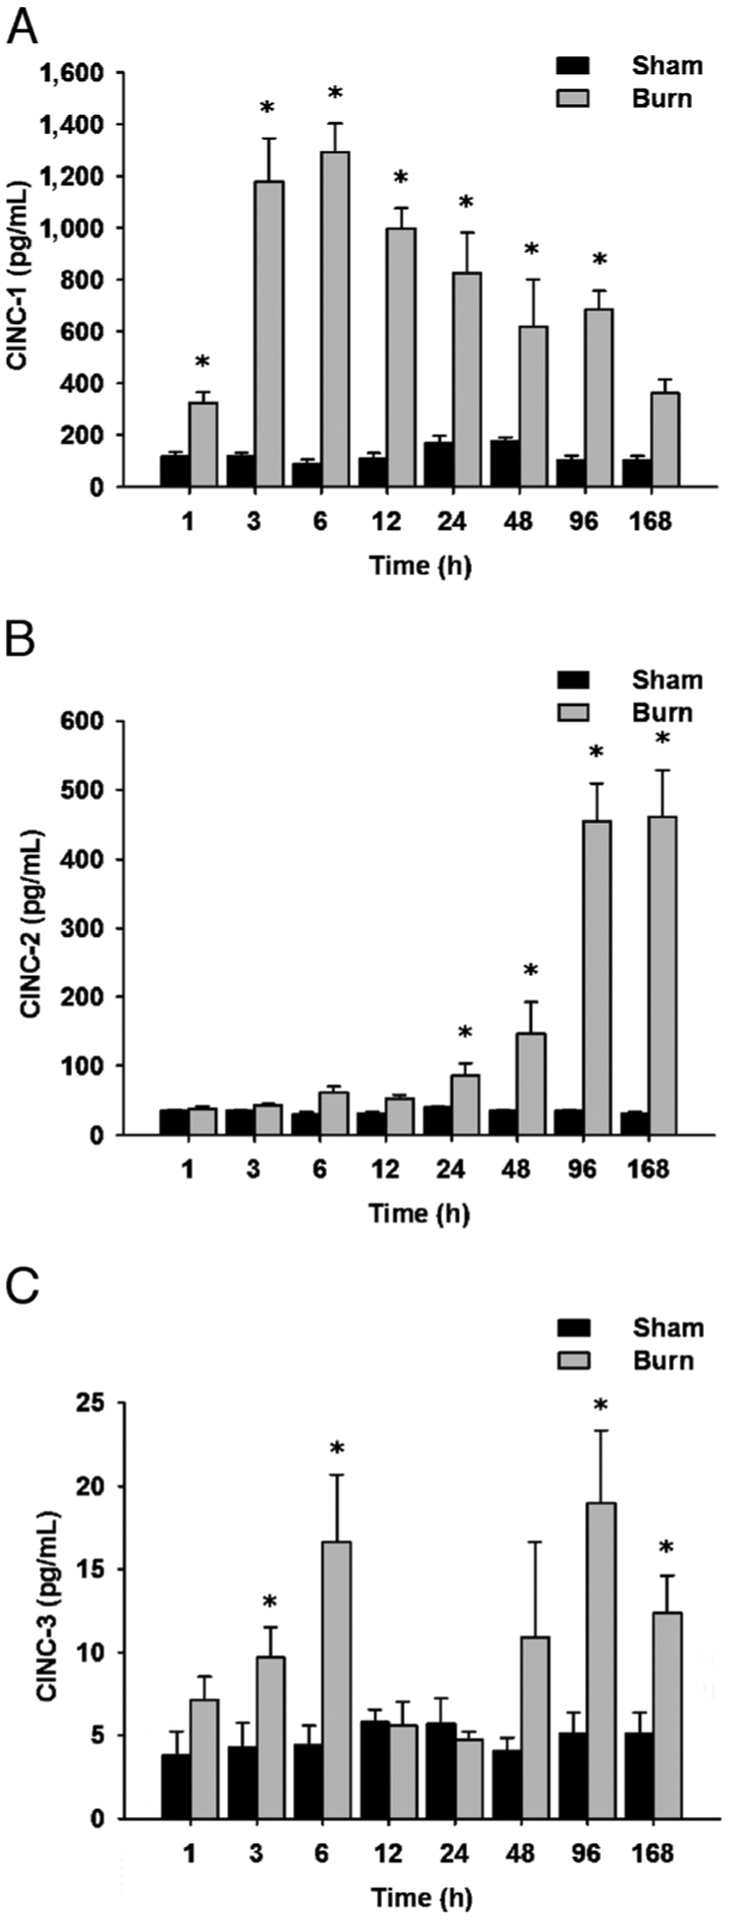
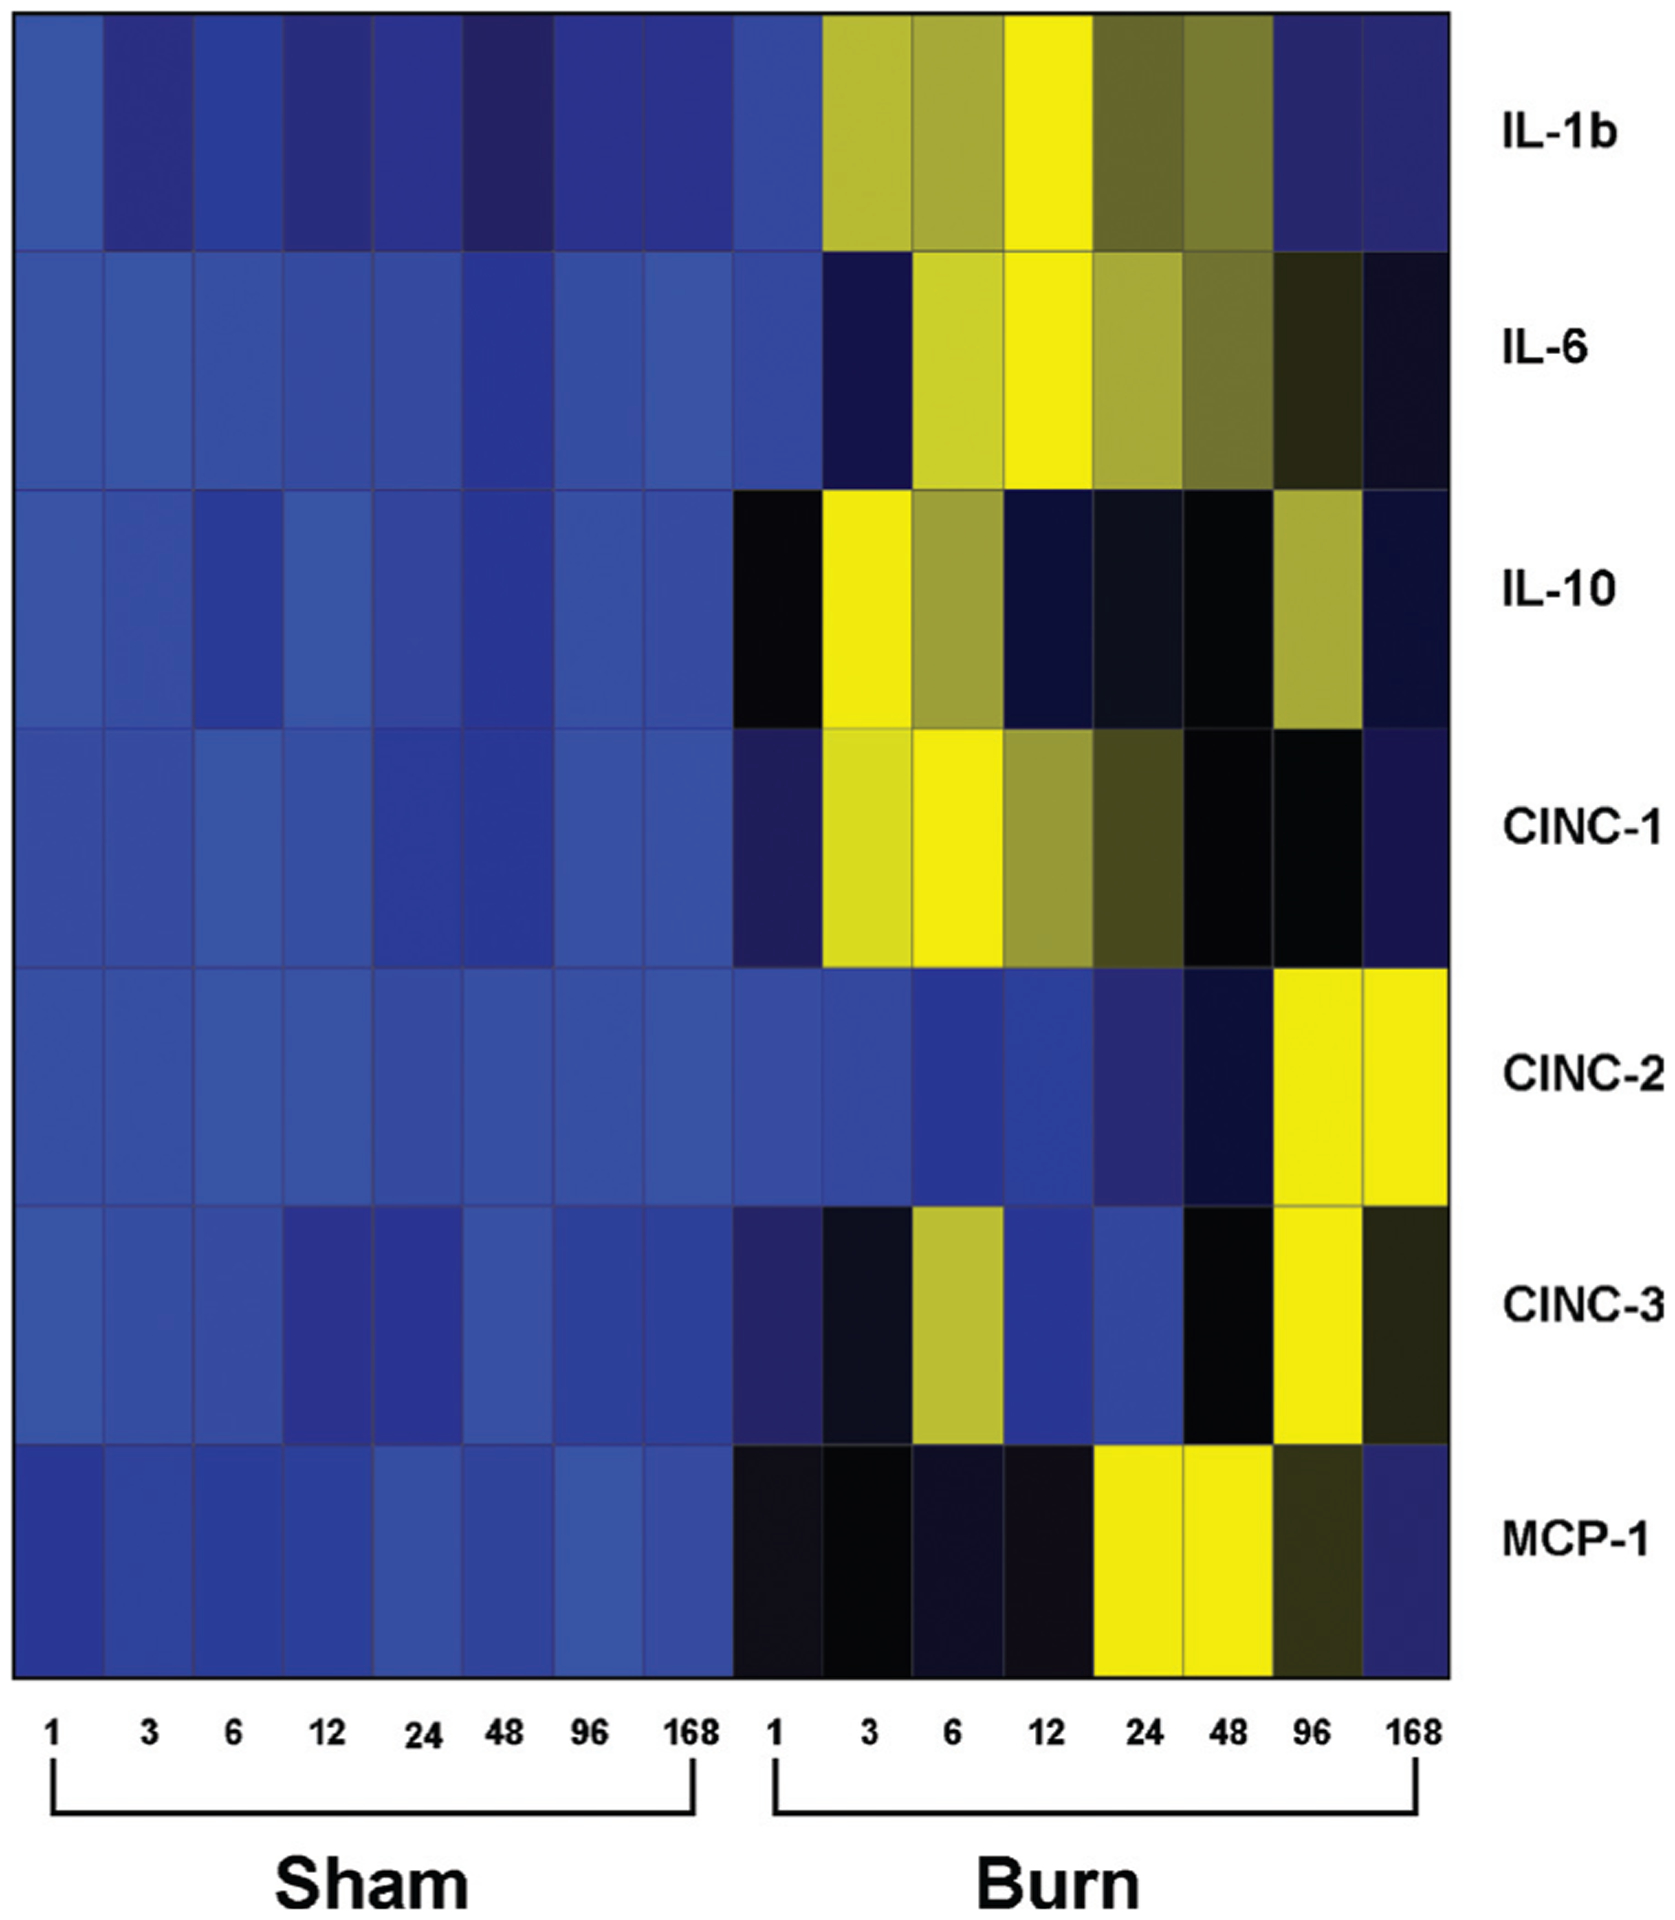
Severe burn causes a pronounced hypermetabolic response characterized by catabolism and extensive protein wasting. We recently found that this hypermetabolic state is driven by a severe inflammatory response. We characterized in detail the kinetics of serum levels of a panel of cytokines in a rat model, which may serve as reference for the development of therapeutic interventions applicable to humans. Male Sprague-Dawley rats (n = 8) received a full-thickness burn of 60% total body surface area. Serum was harvested 1, 3, 6, 12, 24, 48, 96, and 168 h after burn. Eight serum cytokines commonly used to assess the inflammatory response in humans, such as IL-1beta, IL-6, IL-10, TNF, vascular endothelial growth factor, and monocyte chemotactic protein 1, and the rat-specific cytokines cytokine-induced neutrophil chemoattractant (CINC) 1, CINC-2, and CINC-3 were measured by enzyme-linked immunosorbent assay technique and were compared with controls (n = 4). Statistical analysis was conducted using the t test, with P < 0.05 considered as significantly different. Thermal injury resulted in significantly increased serum levels of IL-1beta, IL-6, IL-10, monocyte chemotactic protein 1, CINC-1, CINC-2, and CINC-3 when compared with the concentrations detected in nonburned rats (P < 0.05). Serum levels of TNF-alpha and vascular endothelial growth factor in burned rats were not found to be significantly different to controls. Burn causes a profound inflammatory response in rats. Specific cytokines known to increase in humans postburn such as IL-1 beta, IL-6, IL-10, MCP-1, and IL-8 (CINC-1, CINC-2, and CINC-3 in the rat) were also observed in our rat burn model, which now allows us to study new anti-inflammatory treatment options.
Figures
Similar articles
-
Impact of anesthesia, analgesia, and euthanasia technique on the inflammatory cytokine profile in a rodent model of severe burn injury.Shock. 2010 Sep;34(3):261-8. doi: 10.1097/shk.0b013e3181d8e2a6. Shock. 2010. PMID: 20803788 Free PMC article.
-
The time course of inflammatory cytokine secretion in a rat model of postoperative pain does not coincide with the onset of mechanical hyperalgesia.Can J Physiol Pharmacol. 2007 Jun;85(6):613-20. doi: 10.1139/y07-054. Can J Physiol Pharmacol. 2007. PMID: 17823623
-
Generation of inflammatory cytokines in zymosan-induced pleurisy in rats: TNF induces IL-6 and cytokine-induced neutrophil chemoattractant (CINC) in vivo.Cytokine. 1998 Dec;10(12):956-63. doi: 10.1006/cyto.1998.0376. Cytokine. 1998. PMID: 10049519
-
[The role of rat cytokine-induced neutrophil chemoattractants (CINCs) in inflammation].Yakugaku Zasshi. 2002 Apr;122(4):263-8. doi: 10.1248/yakushi.122.263. Yakugaku Zasshi. 2002. PMID: 11968838 Review. Japanese.
-
Prediction of severe acute pancreatitis: current knowledge and novel insights.World J Gastroenterol. 2008 Nov 7;14(41):6273-5. doi: 10.3748/wjg.14.6273. World J Gastroenterol. 2008. PMID: 19009638 Free PMC article. Review.
Cited by
-
Long-term dynamic profiling of inflammatory mediators in double-hit burn and sepsis animal models.Cytokine. 2012 May;58(2):307-15. doi: 10.1016/j.cyto.2012.01.017. Epub 2012 Mar 7. Cytokine. 2012. PMID: 22402033 Free PMC article.
-
Pediatric Burn Survivors Have Long-Term Immune Dysfunction With Diminished Vaccine Response.Front Immunol. 2020 Jul 21;11:1481. doi: 10.3389/fimmu.2020.01481. eCollection 2020. Front Immunol. 2020. PMID: 32793203 Free PMC article.
-
Murine scald models characterize the role of neutrophils and neutrophil extracellular traps in severe burns.Front Immunol. 2023 Feb 7;14:1113948. doi: 10.3389/fimmu.2023.1113948. eCollection 2023. Front Immunol. 2023. PMID: 36825027 Free PMC article.
-
Insulin resistance postburn: underlying mechanisms and current therapeutic strategies.J Burn Care Res. 2008 Sep-Oct;29(5):683-94. doi: 10.1097/BCR.0b013e31818481ce. J Burn Care Res. 2008. PMID: 18695610 Free PMC article. Review.
-
Predictive Value of IL-8 for Sepsis and Severe Infections After Burn Injury: A Clinical Study.Shock. 2015 Mar;43(3):222-7. doi: 10.1097/SHK.0000000000000294. Shock. 2015. PMID: 25514427 Free PMC article. Clinical Trial.
References
-
- Nyhlen K, Gautam C, Andersson R, Srinivas U: Modulation of cytokine-induced production of IL-8 in vitro by interferons and glucocorticosteroids. Inflammation 28(2):77–88, 2004. - PubMed
-
- de Bandt JP, Chollet-Martin S, Hernvann A, Lioret N, du Roure LD, Lim SK, Vaubourdolle M, Guechot J, Saizy R, Giboudeau J, et al.: Cytokine response to burn injury: relationship with protein metabolism. J Trauma 36(5):624–628, 1994. - PubMed
-
- Ueyama M, Maruyama I, Osame M, Sawada Y: Marked increase in plasma interleukin-6 in burn patients. J Lab Clin Med 120(5):693–698, 1992. - PubMed
-
- Endo S, Inada K, Yamada Y, Kasai T, Takakuwa T, Nakae H, Kikuchi M, Hoshi S, Suzuki M, Yamashita H, et al.: Plasma tumour necrosis factor-alpha (TNF-alpha) levels in patients with burns. Burns 19(2):124–127, 1993. - PubMed
-
- Finnerty CC, Herndon DN, Przkora R, Pereira CT, Oliveira HM, Queiroz DM, Rocha AM, Jeschke MG: Cytokine expression profile over time in severely burned pediatric patients. Shock 26(1):13–19, 2006. - PubMed
Publication types
MeSH terms
Substances
Grants and funding
LinkOut - more resources
Full Text Sources
Medical
Molecular Biology Databases
Research Materials
Miscellaneous