Dimensionality and dynamics in the behavior of C. elegans
- PMID: 18389066
- PMCID: PMC2276863
- DOI: 10.1371/journal.pcbi.1000028
Dimensionality and dynamics in the behavior of C. elegans
Abstract
A major challenge in analyzing animal behavior is to discover some underlying simplicity in complex motor actions. Here, we show that the space of shapes adopted by the nematode Caenorhabditis elegans is low dimensional, with just four dimensions accounting for 95% of the shape variance. These dimensions provide a quantitative description of worm behavior, and we partially reconstruct "equations of motion" for the dynamics in this space. These dynamics have multiple attractors, and we find that the worm visits these in a rapid and almost completely deterministic response to weak thermal stimuli. Stimulus-dependent correlations among the different modes suggest that one can generate more reliable behaviors by synchronizing stimuli to the state of the worm in shape space. We confirm this prediction, effectively "steering" the worm in real time.
Conflict of interest statement
The authors have declared that no competing interests exist.
Figures

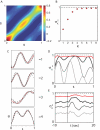
 (s) and normal
  (s) to the curve at each point. The tangent points in a direction θ(s), and variations in this angle correspond to the curvature κ(s) = dθ(s)/ds. (D) All images are rotated so that 〈θ〉 = 0; therefore θ (s) provides a description of the worm's shape that is independent of our coordinate system, and intrinsic to the worm itself.

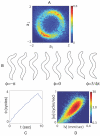
 . The ring structure suggests that these modes form an oscillator with approximately fixed amplitude and varying phase φ = tan-1(-a
2/a
1). (B) Images of worms with different values of φ show that variation in phase corresponds to propagating a wave of bending along the worm’s body. (C) Dynamics of the phase φ(t) shows long periods of linear growth, corresponding to a steady rotation in the {a
1, a
2} plane, with occasional, abrupt reversals. (D) The joint density ρ(|ν|,|ω|). The phase velocity ω = dφ/dt in shape space predicts worm’s crawling speed.
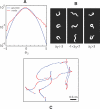
 , and for comparison we show the Gaussian distribution; note the longer tails in ρ(a
3). (B) Images of worms with values of a
3 in the negative tail (left), the middle (center) and positive tail (right). Large negative and positive amplitudes of a
3 correspond to bends in the dorsal and ventral direction, respectively. (C) A two minute trajectory of the center of mass sampled at 4 Hz. Periods where |a
3|>1 are colored red, illustrating the association between turning and large displacements along this mode.

 . Shortly after the thermal impulse (t, t′>0) the modes develop a strong anti-correlation which is distinct from normal crawling. (C) Phase dependent thermal response. Worms stimulated during ventral head swings (−2≤φ≤−1) turn dorsally (red) while worms stimulated during dorsal head swings (2≤φ≤π) turn ventrally (blue). When phase is ignored there is no discernible response (grey). Solid lines denote averages while colored bands display standard deviation of the mean. (D) Worm “steering.” A thermal impulse conditioned on the instantaneous phase was delivered automatically and repeatedly, causing an orientation change
  in the worm's trajectory. In this example lasting 4 minutes, asynchronous impulses produced a time-averaged orientation change 〈
 〉 = 0.01 rad/s (black), impulses at positive phase produced a trajectory with 〈
 〉 = 0.10 rad/s (blue), and impulses at negative phase produced 〈
 〉 = –0.12 rad/s (red). This trajectory response is consistent with the mode correlations seen in Figure 6C. We found 13 out of 20 worms produced statistically different orientation changes under stimulated and non-simulated conditions while only 1 out of 20 worms responded in the same fashion when the phase was randomized (p<0.01, Fisher exact test).
Similar articles
-
Emergence of long timescales and stereotyped behaviors in Caenorhabditis elegans.Proc Natl Acad Sci U S A. 2011 May 3;108(18):7286-9. doi: 10.1073/pnas.1007868108. Epub 2011 Apr 18. Proc Natl Acad Sci U S A. 2011. PMID: 21502536 Free PMC article.
-
A computational model for C. elegans locomotory behavior: application to multiworm tracking.IEEE Trans Biomed Eng. 2007 Oct;54(10):1786-97. doi: 10.1109/TBME.2007.894981. IEEE Trans Biomed Eng. 2007. PMID: 17926677
-
Dimensionality of locomotor behaviors in developing C. elegans.PLoS Comput Biol. 2024 Mar 4;20(3):e1011906. doi: 10.1371/journal.pcbi.1011906. eCollection 2024 Mar. PLoS Comput Biol. 2024. PMID: 38437243 Free PMC article.
-
The Si elegans project at the interface of experimental and computational Caenorhabditis elegans neurobiology and behavior.J Neural Eng. 2016 Dec;13(6):065001. doi: 10.1088/1741-2560/13/6/065001. Epub 2016 Oct 14. J Neural Eng. 2016. PMID: 27739402 Review.
-
Automated imaging of C. elegans behavior.Methods Mol Biol. 2006;351:241-51. doi: 10.1385/1-59745-151-7:241. Methods Mol Biol. 2006. PMID: 16988438 Review.
Cited by
-
Physical manipulation of the Escherichia coli chromosome reveals its soft nature.Proc Natl Acad Sci U S A. 2012 Oct 2;109(40):E2649-56. doi: 10.1073/pnas.1208689109. Epub 2012 Sep 14. Proc Natl Acad Sci U S A. 2012. PMID: 22984156 Free PMC article.
-
Track-a-worm, an open-source system for quantitative assessment of C. elegans locomotory and bending behavior.PLoS One. 2013 Jul 26;8(7):e69653. doi: 10.1371/journal.pone.0069653. Print 2013. PLoS One. 2013. PMID: 23922769 Free PMC article.
-
Probabilistic Models of Larval Zebrafish Behavior Reveal Structure on Many Scales.Curr Biol. 2020 Jan 6;30(1):70-82.e4. doi: 10.1016/j.cub.2019.11.026. Epub 2019 Dec 19. Curr Biol. 2020. PMID: 31866367 Free PMC article.
-
Recording and Quantifying C. elegans Behavior.Methods Mol Biol. 2022;2468:357-373. doi: 10.1007/978-1-0716-2181-3_20. Methods Mol Biol. 2022. PMID: 35320576
-
Neural Interactome: Interactive Simulation of a Neuronal System.Front Comput Neurosci. 2019 Mar 13;13:8. doi: 10.3389/fncom.2019.00008. eCollection 2019. Front Comput Neurosci. 2019. PMID: 30930759 Free PMC article.
References
-
- Green DM, Swets JA. New York: John Wiley & Sons; 1966. Signal Detection Theory and Psychophysics.
-
- Bolhuis J, Giraldeau L, editors. Oxford: Blackwell Publishing; 2004. The Behavior of Animals: Mechanism, Function and Evolution.
-
- Hoshi K, Shingai R. Computer–driven automatic identification of locomotion states in Caenorhabditis elegans. J Neurosci Meth. 2006;157:355–363. - PubMed
MeSH terms
LinkOut - more resources
Full Text Sources
Other Literature Sources

