

Self-assembling nanofibers inhibit glial scar formation and promote axon elongation after spinal cord injury
- PMID: 18385339
- PMCID: PMC2752951
- DOI: 10.1523/JNEUROSCI.0143-08.2008
Self-assembling nanofibers inhibit glial scar formation and promote axon elongation after spinal cord injury
Abstract
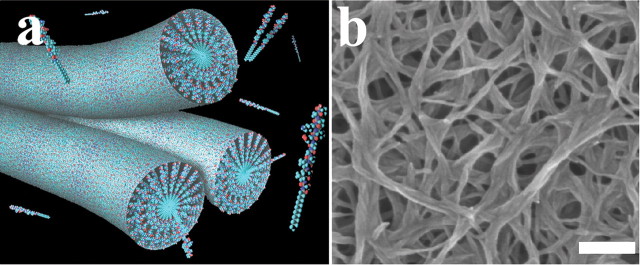
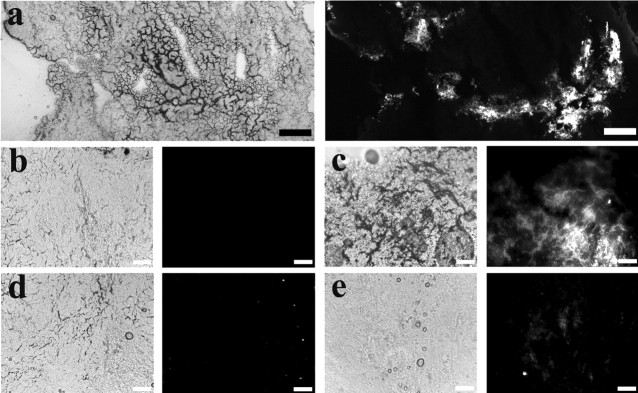
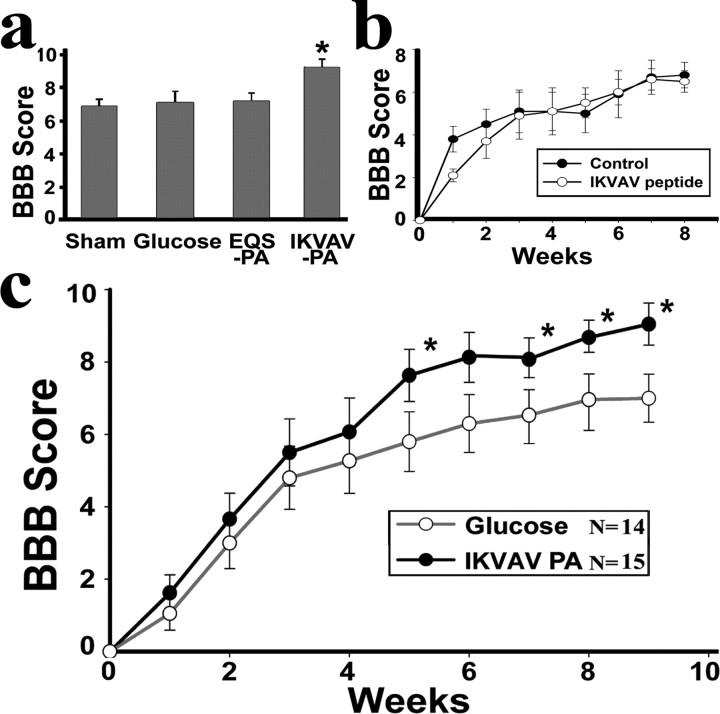
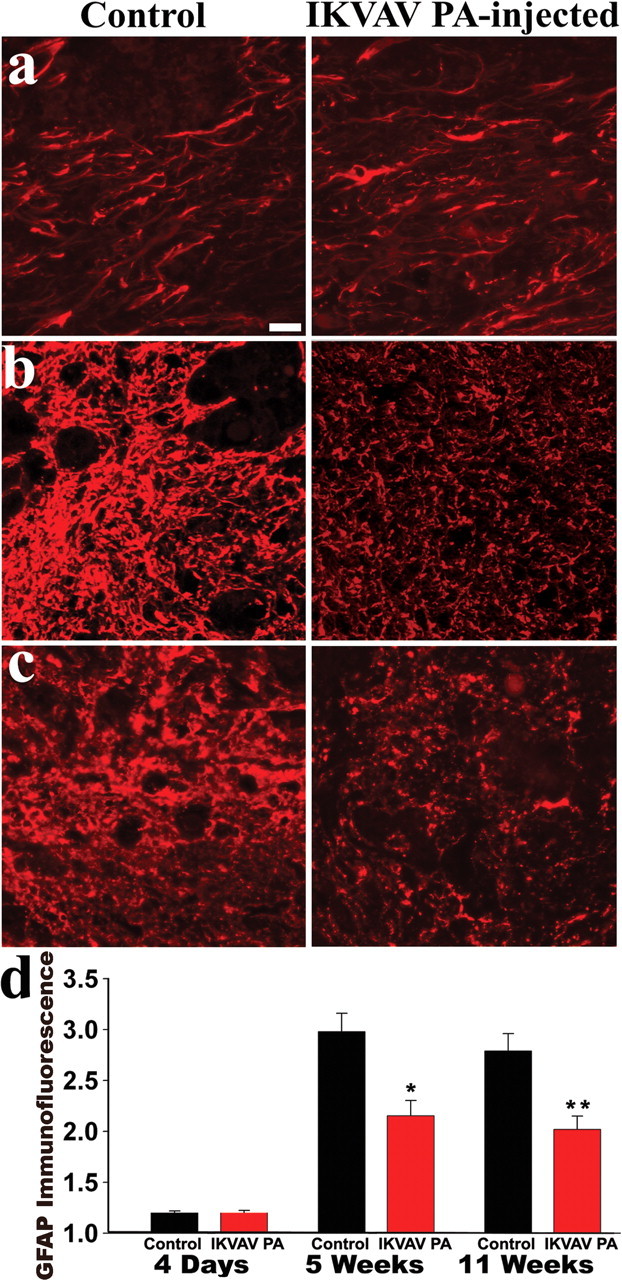
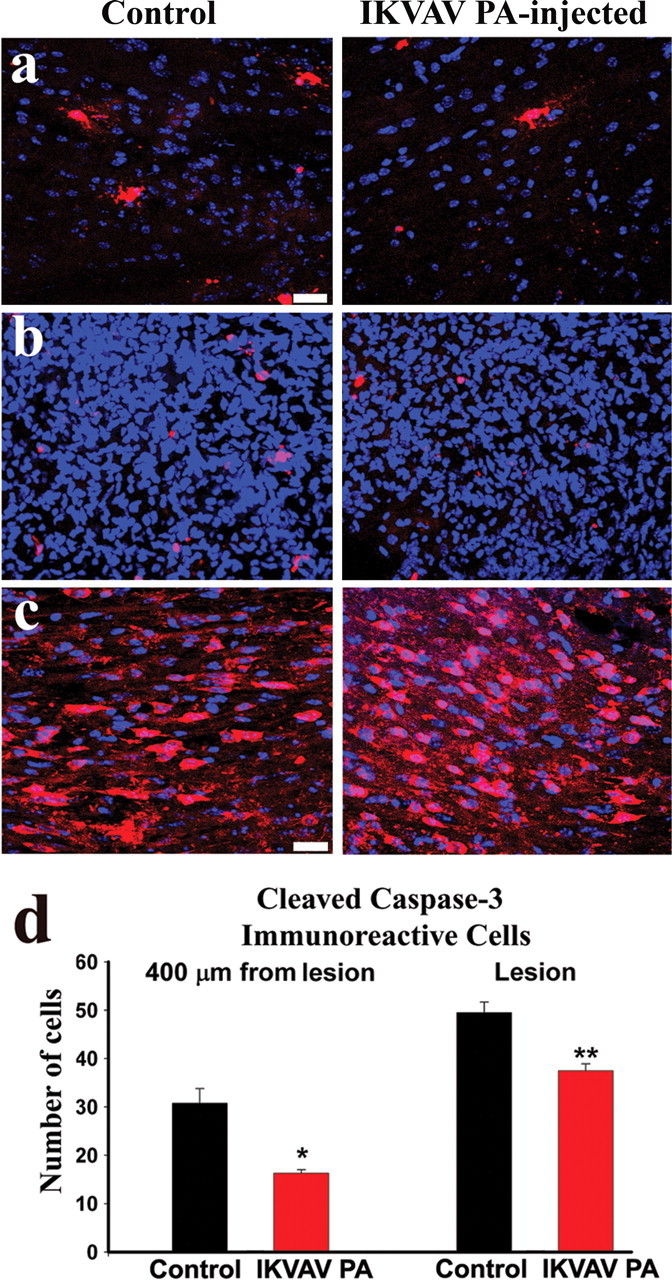
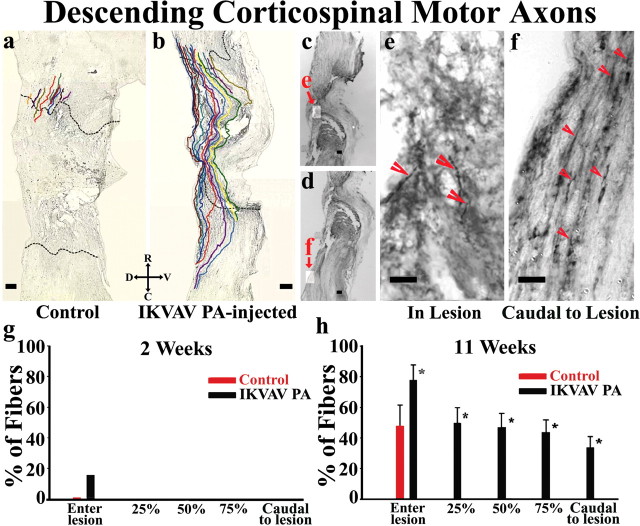
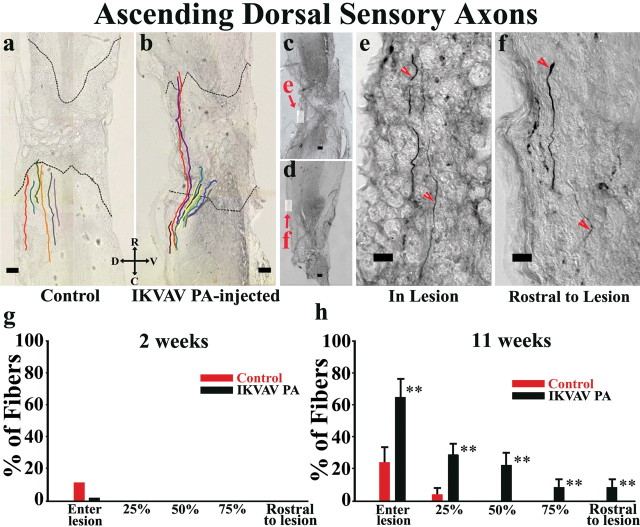
Peptide amphiphile (PA) molecules that self-assemble in vivo into supramolecular nanofibers were used as a therapy in a mouse model of spinal cord injury (SCI). Because self-assembly of these molecules is triggered by the ionic strength of the in vivo environment, nanoscale structures can be created within the extracellular spaces of the spinal cord by simply injecting a liquid. The molecules are designed to form cylindrical nanofibers that display to cells in the spinal cord the laminin epitope IKVAV at nearly van der Waals density. IKVAV PA nanofibers are known to inhibit glial differentiation of cultured neural stem cells and to promote neurite outgrowth from cultured neurons. In this work, in vivo treatment with the PA after SCI reduced astrogliosis, reduced cell death, and increased the number of oligodendroglia at the site of injury. Furthermore, the nanofibers promoted regeneration of both descending motor fibers and ascending sensory fibers through the lesion site. Treatment with the PA also resulted in significant behavioral improvement. These observations demonstrate that it is possible to inhibit glial scar formation and to facilitate regeneration after SCI using bioactive three-dimensional nanostructures displaying high densities of neuroactive epitopes on their surfaces.
Figures
Similar articles
-
Self-assembling peptide amphiphile promotes plasticity of serotonergic fibers following spinal cord injury.J Neurosci Res. 2010 Nov 1;88(14):3161-70. doi: 10.1002/jnr.22472. J Neurosci Res. 2010. PMID: 20818775 Free PMC article.
-
Expressing Constitutively Active Rheb in Adult Neurons after a Complete Spinal Cord Injury Enhances Axonal Regeneration beyond a Chondroitinase-Treated Glial Scar.J Neurosci. 2015 Aug 5;35(31):11068-80. doi: 10.1523/JNEUROSCI.0719-15.2015. J Neurosci. 2015. PMID: 26245968 Free PMC article.
-
Effects of granulocyte colony-stimulating factor and granulocyte-macrophage colony-stimulating factor on glial scar formation after spinal cord injury in rats.J Neurosurg Spine. 2014 Dec;21(6):966-73. doi: 10.3171/2014.8.SPINE131090. Epub 2014 Oct 3. J Neurosurg Spine. 2014. PMID: 25279652
-
Scaffold-facilitated locomotor improvement post complete spinal cord injury: Motor axon regeneration versus endogenous neuronal relay formation.Biomaterials. 2019 Mar;197:20-31. doi: 10.1016/j.biomaterials.2019.01.012. Epub 2019 Jan 7. Biomaterials. 2019. PMID: 30639547 Review.
-
Effects of Electrospun Nanofibers on Motor Function Recovery After Spinal Cord Injury: A Systematic Review and Meta-Analysis.World Neurosurg. 2024 Jan;181:96-106. doi: 10.1016/j.wneu.2023.10.065. Epub 2023 Oct 16. World Neurosurg. 2024. PMID: 37852475 Review.
Cited by
-
Nanotechnology in the Regeneration of Complex Tissues.Bone Tissue Regen Insights. 2014 Nov 12;5:25-35. doi: 10.4137/BTRI.S12331. Bone Tissue Regen Insights. 2014. PMID: 26097381 Free PMC article.
-
A tenascin-C mimetic peptide amphiphile nanofiber gel promotes neurite outgrowth and cell migration of neurosphere-derived cells.Acta Biomater. 2016 Jun;37:50-8. doi: 10.1016/j.actbio.2016.04.010. Epub 2016 Apr 7. Acta Biomater. 2016. PMID: 27063496 Free PMC article.
-
In vitro and in vivo Evaluation of the Bioactive Nanofibers-Encapsulated Benzalkonium Bromide for Accelerating Wound Repair with MRSA Skin Infection.Int J Nanomedicine. 2022 Sep 21;17:4419-4432. doi: 10.2147/IJN.S380786. eCollection 2022. Int J Nanomedicine. 2022. PMID: 36172005 Free PMC article.
-
Coassembled cytotoxic and pegylated peptide amphiphiles form filamentous nanostructures with potent antitumor activity in models of breast cancer.ACS Nano. 2012 Sep 25;6(9):7956-65. doi: 10.1021/nn302503s. Epub 2012 Aug 28. ACS Nano. 2012. PMID: 22928955 Free PMC article.
-
Rheological properties of peptide-based hydrogels for biomedical and other applications.Chem Soc Rev. 2010 Sep;39(9):3528-40. doi: 10.1039/b919449p. Epub 2010 Apr 26. Chem Soc Rev. 2010. PMID: 20422104 Free PMC article. Review.
References
-
- Basso DM, Beattie MS, Bresnahan JC, Anderson DK, Faden AI, Gruner JA, Holford TR, Hsu CY, Noble LJ, Nockels R, Perot PL, Salzman SK, Young W. MASCIS evaluation of open field locomotor scores: effects of experience and teamwork on reliability. Multicenter animal spinal cord injury study. J Neurotrauma. 1996;13:343–359. - PubMed
-
- Bunge MB. Bridging areas of injury in the spinal cord. Neuroscientist. 2001;7:325–339. - PubMed
-
- Bush TG, Puvanachandra N, Horner CH, Polito A, Ostenfeld T, Svendsen CN, Mucke L, Johnson MH, Sofroniew MV. Leukocyte infiltration, neuronal degeneration, and neurite outgrowth after ablation of scar-forming, reactive astrocytes in adult transgenic mice. Neuron. 1999;23:297–308. - PubMed
-
- Crowe MJ, Bresnahan JC, Shuman SL, Masters JN, Beattie MS. Apoptosis and delayed degeneration after spinal cord injury in rats and monkeys. Nat Med. 1997;3:73–76. - PubMed
Publication types
MeSH terms
Substances
Grants and funding
LinkOut - more resources
Full Text Sources
Other Literature Sources
Medical